
FOCUS ON: Debt Ceiling Talks Approaching 1st June Deadline
- US dollar and stocks strengthened on the back of positive news from Washington last week
- US Federal debt ceiling talks are far from complete
- Price volatility expected to increase as the 1st June deadline for a resolution approaches
Trading Ideas
We created this Weekly Tips section to share possible trade entry and exit points based on our technical analysis. We also have other methods to validate our trades which we can’t publicly share that help to increase their success. All our trades include entry and at least one target price. Stop losses are applied at the reader’s discretion. Our strategies typically trade with a wide stop loss, and risk is further mitigated by trading in small sizes.
Instrument | Price | Hourly | Daily |
GBP/USD | 1.2440 | Neutral | Sell |
EUR/USD | 1.0804 | Buy | Strong Sell |
USD/JPY | 137.92 | Sell | Strong Buy |
S&P 500 | 4,184 | Strong Buy | Strong Buy |
NASDAQ 100 | 13,782 | Strong Buy | Strong Buy |
FTSE100 | 7,770 | Strong Sell | Neutral |
Gold | 1,977 | Strong Buy | Strong Sell |
Crude Oil WTI | 71.86 | Strong Sell | Strong Sell |
Bitcoin | 26,837 | Strong Buy | Buy |
Ethereum | 1,804 | Strong Buy | Buy |
UTC: 08:26
US Dollar Basket Index (DXY)
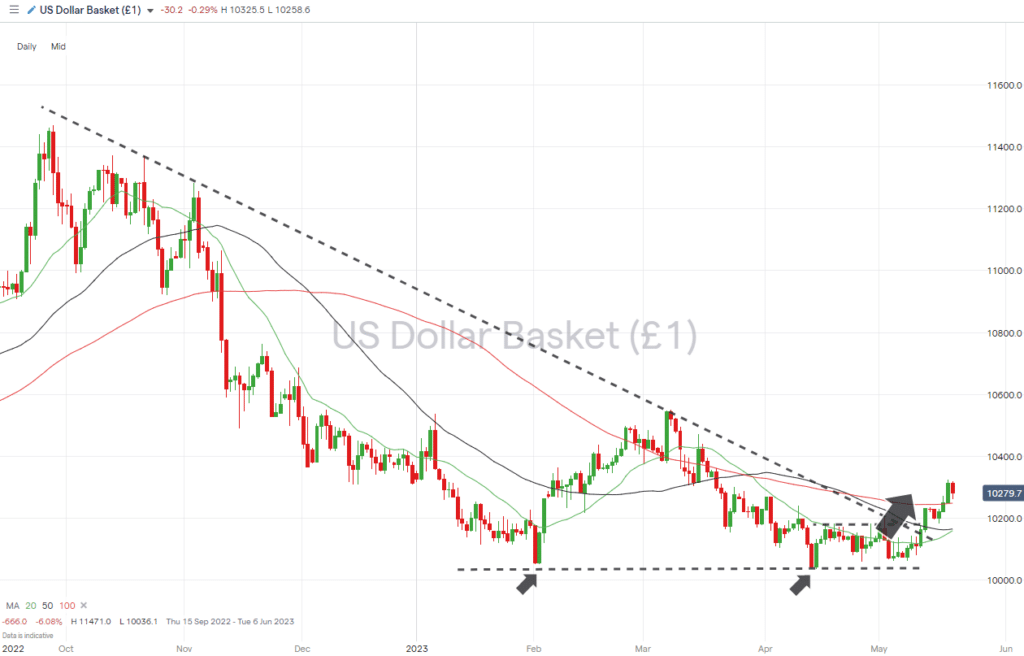
Last week’s strength in the US Dollar Basket Index was triggered by debt-ceiling negotiations appearing to take a positive turn. It’s early days, but President Joe Biden headed off to the G7 summit in Tokyo believing that enough progress had been made in negotiations to avoid the US government defaulting on its financial obligations on 1st June.
The 0.50% week-on-week increase in value in the US Dollar Index and break of the long-term downward trendline may be more of a relief rally or part of a short-squeeze than a confirmed move. Traders could find opportunities to enter short and long positions in the coming days.
US Dollar Basket Chart – Daily Price Chart – Breakout of Descending Wedge Pattern
Source: IG
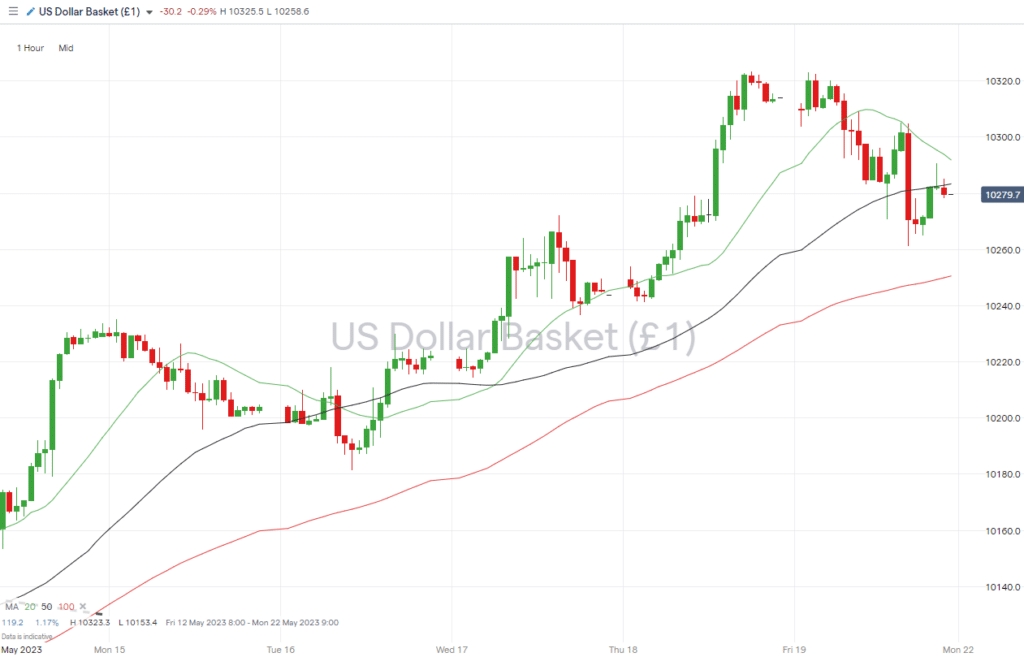
US Dollar Basket Chart – Hourly Price Chart
Source: IG
Short positions
- Entry Level 1: 102.57 – Region of the 20 SMA on the Weekly Price Chart. Acted as resistance to upward price moves since October 2022. Also, the region of the 100 SMA on the Daily Price Chart (102.48).
- Price Target 1: 101.81 – Intraday low, which forms swing-low pattern of the price rise dating from 4th May.
- Price Target 2: 101.64 – 100 SMA on the Daily Price Chart.
- Stop Loss: > 103.23 – Price high recorded on Thursday 18th May.
Long positions
- Entry Level 1: 102.48 – Despite the recent surge in value in the DXY index, the RSI on the Daily Price Chart currently sits at 62.2, which means it is far from overbought in that timeframe. A pullback to the 100 SMA on the Daily Price Chart could provide an entry point for those looking to go long.
- Price Target 1: 103.23 – Month to date price high.
- Stop Loss: < 101.59 – Region of the convergence of the 20 and 50 SMAs on Daily Price Chart.
GBPUSD
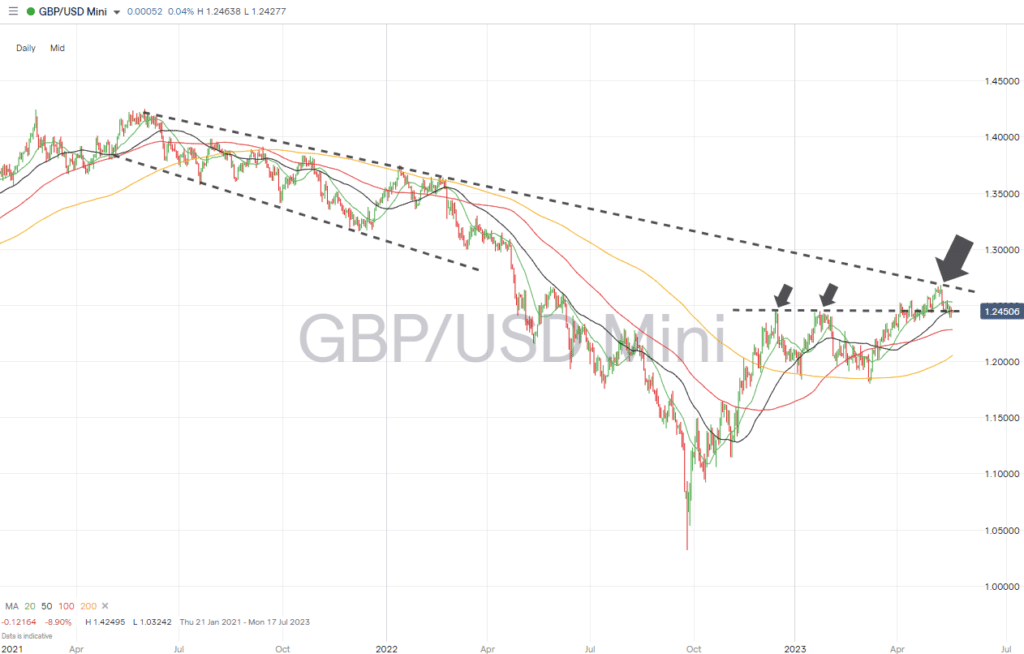
Cable’s lack of direction has resulted in it funnelling into a wedge pattern formed by the upper trendline of the downward price move started in June 2021 and the support level of 1.24480. Having spent the previous week testing the lower levels of that pattern, the lack of overall direction could be resolved when the situation with US debt-ceiling negotiations becomes clearer.
Daily Price Chart – GBPUSD Chart – Daily Price Chart
Source: IG
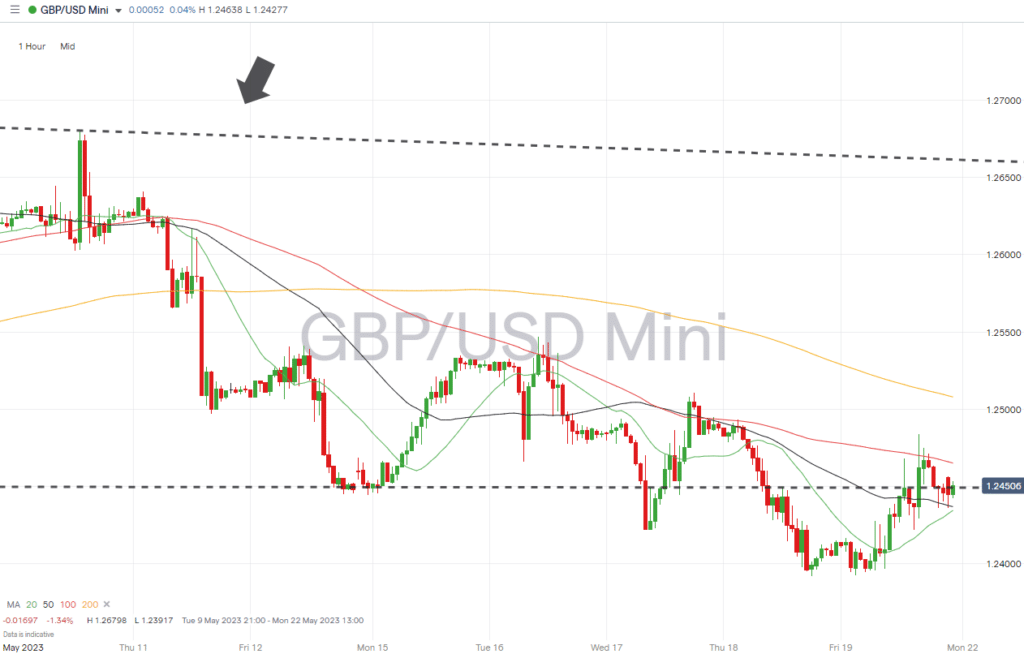
GBPUSD Chart – Hourly Price Chart
Source: IG
Short positions
- Entry Level 1: 1.24480 – Applying a momentum-based strategy should the price of GBPUSD break through the support level formed by the price high of 23rd January 2023. That high, along with the one of 14th December, previously offered resistance as part of a double-top price pattern and now offers support.
- Price Target 1: 1.22845 – Region of 100 SMA on Daily Price Chart.
- Price Target 2: 1.18030 – In extension, swing-low price recorded on 8th March 2023.
- Stop Loss: > 1.24555 – Region of the 100 SMA on the Daily Price Chart.
Long positions
- Entry Level 1: 1.24555 – There is considerable support in the region of the 50 SMA on the Daily Price Chart, which means the price level represents a trade entry point for those looking to go long GBPUSD.
- Price Target 1: 1.25290 – Region of 20 SMA on the Daily Price Chart.
- Price Target 2: 1.26798 – in extension, year-to-date price high of 10th May.
- Stop Loss: < 1.23917 – There are few support levels below the monthly price low recorded on Thursday 18th May, which means a relatively tight stop-loss is advisable.
EURUSD
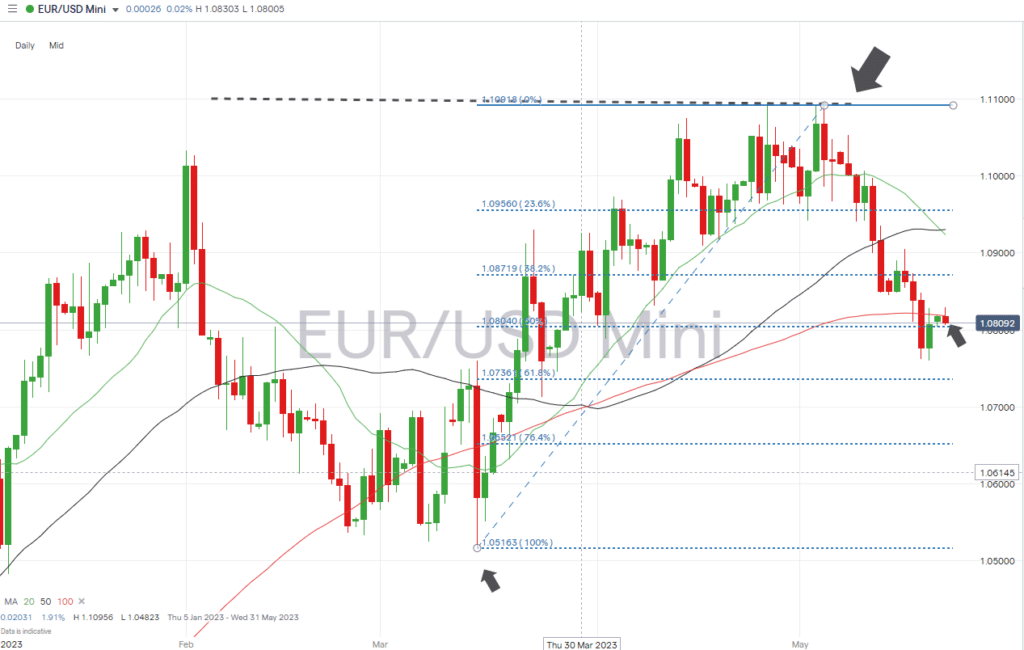
Price action in the euro-dollar pair since 4th May has been decidedly bearish, and a break of the swing-low price point of 15th March (1.05163) would signify a break of the bull run that started in October 2022.
Short-sellers will be challenged by the RSI on the Daily Price Chart, now reading at 38.08 and encroaching on being oversold, which leaves room for the 100 SMA on the Daily Price Chart to act as support.
EURUSD Chart – Daily Price Chart
Source: IG
EURUSD Chart – Hourly Price Chart
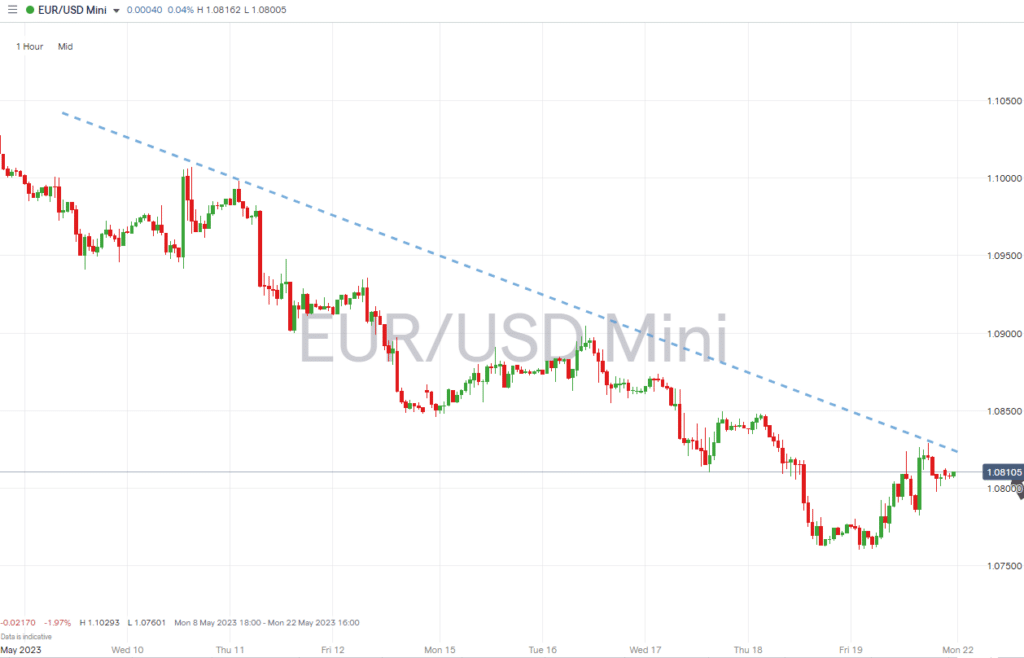
Source: IG
Short positions
- Entry Level 1: 1.08193 – Following the breakthrough of the 100 SMA on the Daily Price Chart, that metric which previously offered support can now be expected to provide resistance to further upward price moves.
- Price Target 1: 1.07601 – Intraday price low of Friday 19th May.
- Stop Loss: > 1.0830 – Region of the 100 SMA on the Hourly Price Chart.
Long positions
- Entry Level 1: 1.0736 – Buying pressure can be expected to build at the price level of the 61.8% Fibonacci retracement of the price rise seen between 15th March and 4th May 2023.
- Price Target 1: 1.0830 – Region of the 100 SMA on the Hourly Price Chart.
- Price Target 2: 1.09294 – In extension, convergence of the 20 and 50 SMAs on the Daily Price Chart.
- Stop Loss: < 1.07133 – Swing-low price low of 24th March.
Indices
S&P 500
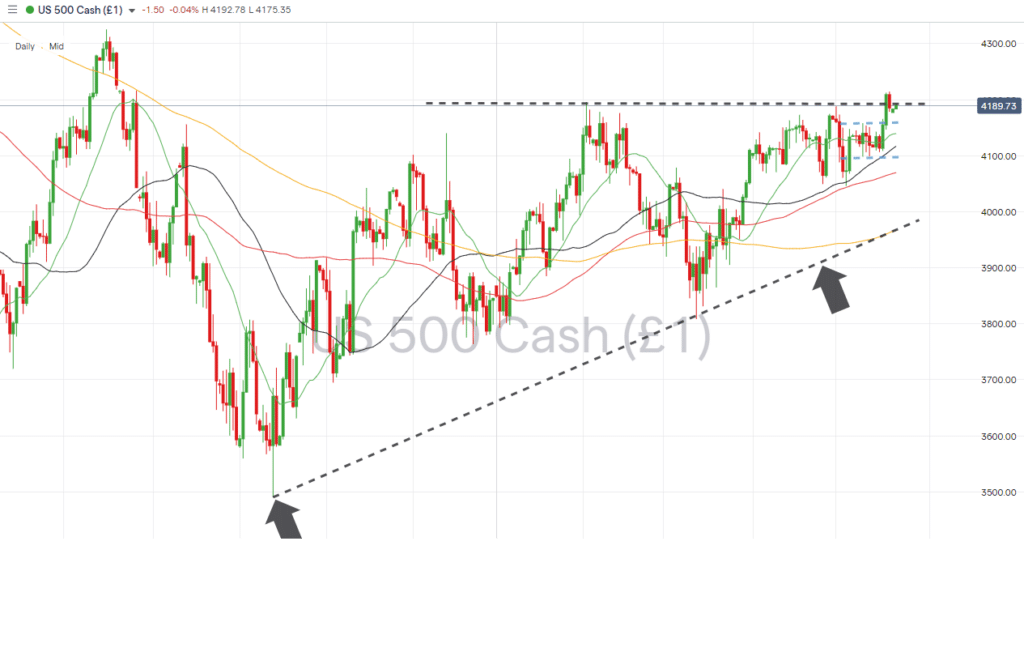
News reports out of Washington last week suggested a resolution of the debt-ceiling issue could be likely and took US stock prices higher. It wasn’t enough to keep the S&P 500 above the key resistance level of 4195, which marks the previous year-to-date high printed on 2nd February.
With the negotiations between Republican and Democrat groups as likely to stall as they are to progress, there is room for further updates to trigger price moves in either direction.
S&P 500 Chart – Daily Price Chart – Ascending Wedge Pattern
Source: IG
S&P 500 – Hourly Price Chart
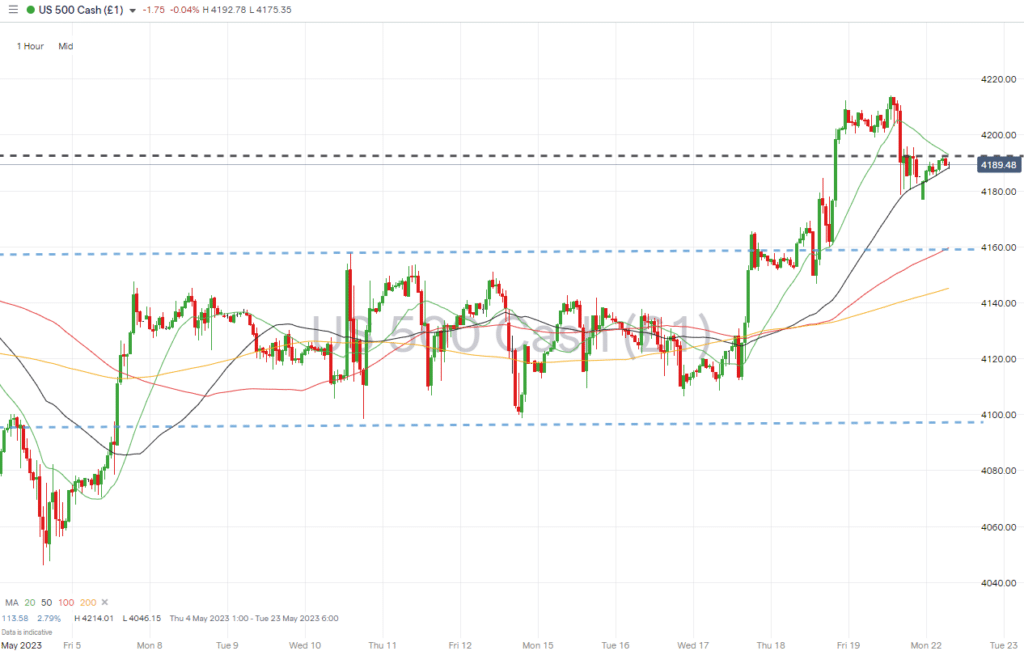
Source: IG
Short positions
- Entry Level 1: 4,195 – Previous year-to-date high printed on 2nd February. Price tested and broke this level on Thursday 18th and Friday 19th May, but ended the week below it.
- Price Target 1: 4,139 – Region of the 20 SMA on Daily Price Chart.
- Price Target 2: 4,046 – Price swing-low of 4th May sits just below the 100 SMA on the Daily Price Chart.
- Stop Loss: > 4,212 – Year-to-date price high recorded on 18th May.
Long positions
- Entry Level 1: 4,195 – Further positive news out of the Capitol would be likely to lift stocks similarly to last week, taking price above the key resistance/support level.
- Price Target 1: 4,310 – 61.8% Fibonacci retracement level of the price fall from 4th January to 13th October 2022.
- Stop Loss: < 4,139 – Region of the 20 SMA on Daily Price Chart.
Crypto – Bitcoin & Ethereum
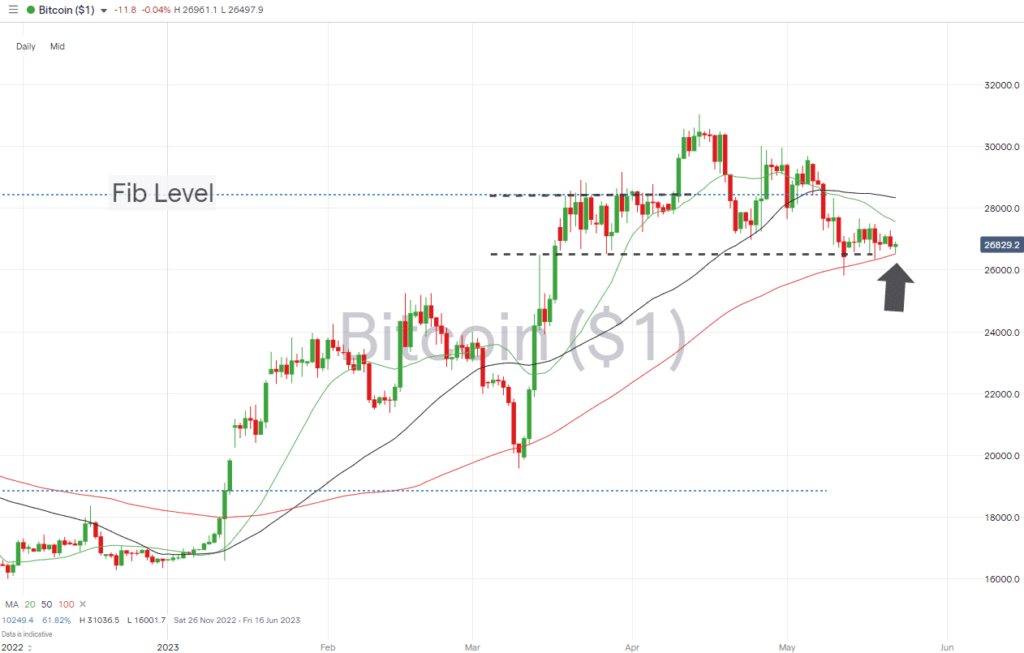
The debt-ceiling impasse should be the type of fiat money crisis that cryptocurrencies thrive on. Investors in digital coins appear to be waiting for the situation to be clearer before making decisions on whether to buy. Still, the week-on-week +1% gains in value recorded by Bitcoin and Ethereum point to long trade opportunities being considered by many.
Both coins continue to find considerable support from the 100 SMA on the Daily Price Chart.
Bitcoin Price Chart – Daily Price Chart
Source: IG
Bitcoin Long positions
- Entry Level 1: 26,523 – Region of the 100 SMA on the Daily Price Chart.
- Price Target 1: 27,672 – Price high of Monday 15th May and region of the 20 SMA on the Daily Price Chart (27,564).
- Price Target 3: 28,952 – Price level formed by the 61.8% Fib retracement of the upwards price move in Bitcoin recorded between February 2019 and November 2021.
- Stop Losses: < 25,829 – Intraday price low of Friday 12th May.
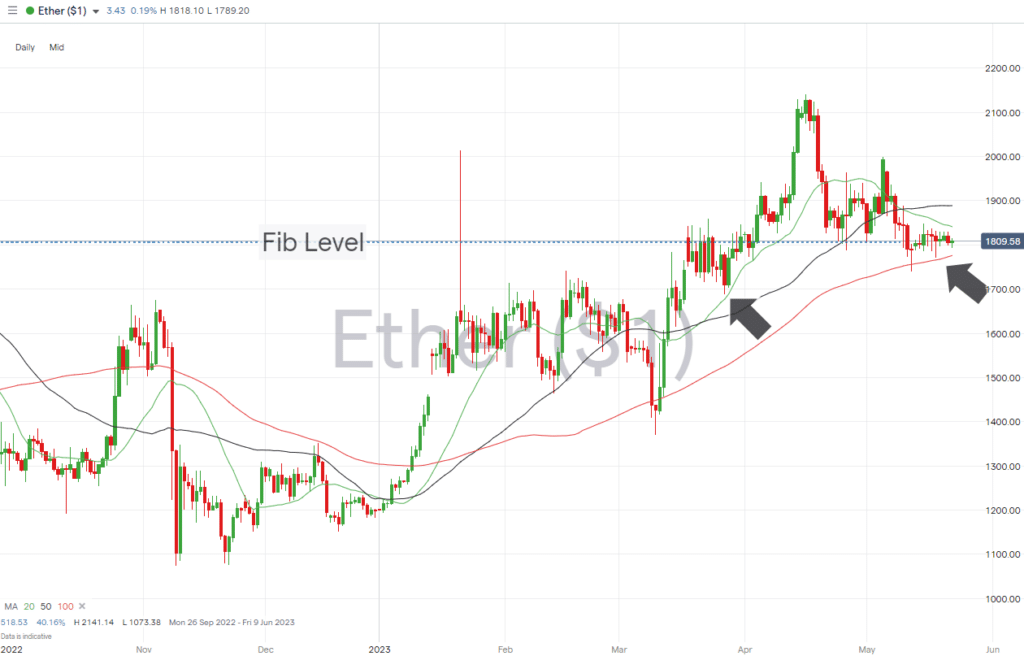
Ethereum
Ethereum Chart – Daily Price Chart
Source: IG
Ethereum Long positions
- Entry Level 1: 1,775 – Region of the 100 SMA on the Daily Price Chart.
- Price Target 1: 1,806 – 23.6% Fibonacci retracement level of November 2021 to June 2022 price fall.
- Price Target 2: 1,888 –Region of the 50 SMA on the Daily Price Chart.
- Price Target 3: 2,000 – In extension, psychologically important round number support/resistance level.
- Stop Losses: < 1,687 – 27th March 2023 swing-low price level.
Risk Statement: Trading financial products carries a high risk to your capital, especially trading leverage products such as CFDs. They may not be suitable for everyone. Please make sure that you fully understand the risks. You should consider whether you can afford to take the risk of losing your money.

Forextraders' Broker of the Month
BlackBull Markets is a reliable and well-respected trading platform that provides its customers with high-quality access to a wide range of asset groups. The broker is headquartered in New Zealand which explains why it has flown under the radar for a few years but it is a great broker that is now building a global following. The BlackBull Markets site is intuitive and easy to use, making it an ideal choice for beginners.