
FOCUS ON: Fed Guidance Looks Most Likely Trigger of a Breakout as Markets Trade Sideways
- Range trading could be the theme of the week.
- Prices in various asset groups are consolidating after a multi-month burst of increased risk appetite.
- Crypto assets are rallying on the belief that US regulators may take a more accommodating view of the sector.
Trading Ideas
We created this Weekly Tips section to share possible trade entry and exit points based on our technical analysis. We also have other methods to validate our trades which we can’t publicly share that help to increase their success. All our trades include entry and at least one target price. Stop losses are applied at the reader’s discretion. Our strategies typically trade with a wide stop loss, and risk is further mitigated by trading in small sizes.
Instrument | Price | Hourly | Daily |
GBP/USD | 1.2724 | Sell | Strong Buy |
EUR/USD | 1.0902 | Neutral | Strong Buy |
USD/JPY | 143.45 | Neutral | Strong Buy |
S&P 500 | 4,351 | Strong Sell | Strong Buy |
NASDAQ 100 | 14,894 | Strong Sell | Strong Buy |
FTSE100 | 7,459 | Strong Sell | Strong Sell |
Gold | 1,923 | Sell | Strong Sell |
Crude Oil WTI | 69.81 | Strong Buy | Strong Sell |
Bitcoin | 30,472 | Strong Buy | Strong Buy |
Ethereum | 1,895 | Strong Buy | Strong Buy |
UTC: 09:03
US Dollar Basket Index (DXY)
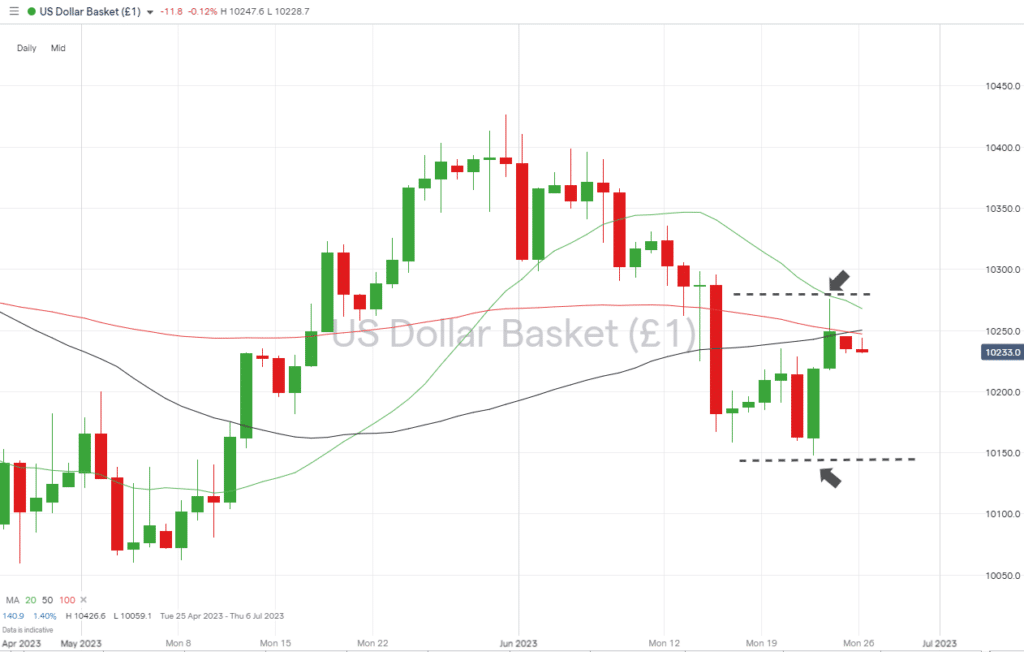
The Fed’s decision earlier in the month to pause its programme of interest rate rises left analysts focussing on the ‘guidance’ offered by Jerome Powell and his team. Disseminating the comments of Fed officials relies on interpretation rather than hard facts and has resulted in a period of price consolidation for the US Dollar Basket index. Powell will update the markets on Wednesday, but with few other major news announcements due this week, the formation of a distinct trend appears unlikely, making strategies focusing on range-bound trading a popular choice.
US Dollar Basket Chart – Daily Price Chart – Price Consolidation
Source: IG
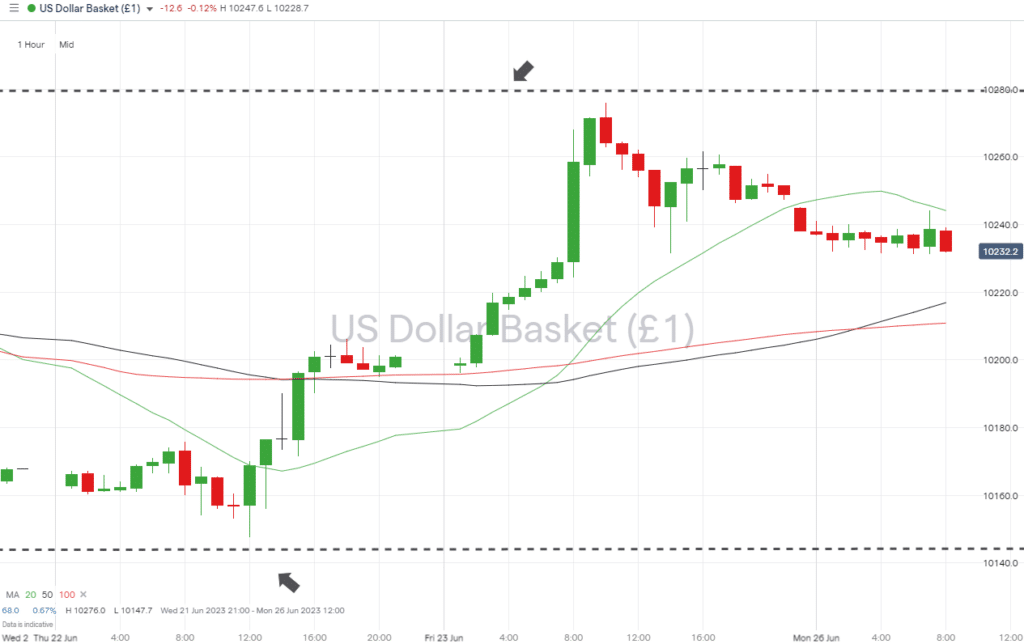
US Dollar Basket Chart – Hourly Price Chart
Source: IG
Short positions
- Entry Level 1: 102.67 – The 20 SMA on the Daily Price Chart acted as resistance on Friday 23rd June. Price hasn’t traded above that metric since 8th June, which makes it a possible trade entry point for those looking to short the DXY.
- Price Target 1: 101.62 – Closing price of Wednesday 21st June.
- Price Target 2: 101.47 – Month-to-date price low recorded on 22nd June.
- Stop Loss: > 102.76 – Price high of Friday 23rd June, which marks the top of the sideways channel formed by last week’s price movements.
Long positions
- Entry Level 1: 101.62 – Closing price of Wednesday 21st June. The lowest closing price recorded since 11th May.
- Price Target 1: 102.47 – Region of the convergence between the 50 and 100 SMAs on the Daily Price Chart.
- Price Target 2: 102.76 – Price high recorded intraday on Friday 23rd June. Resistance trendline of the recently formed sideways price pattern.
- Stop Loss: < 101.47 – Price low of 22nd June.
GBPUSD
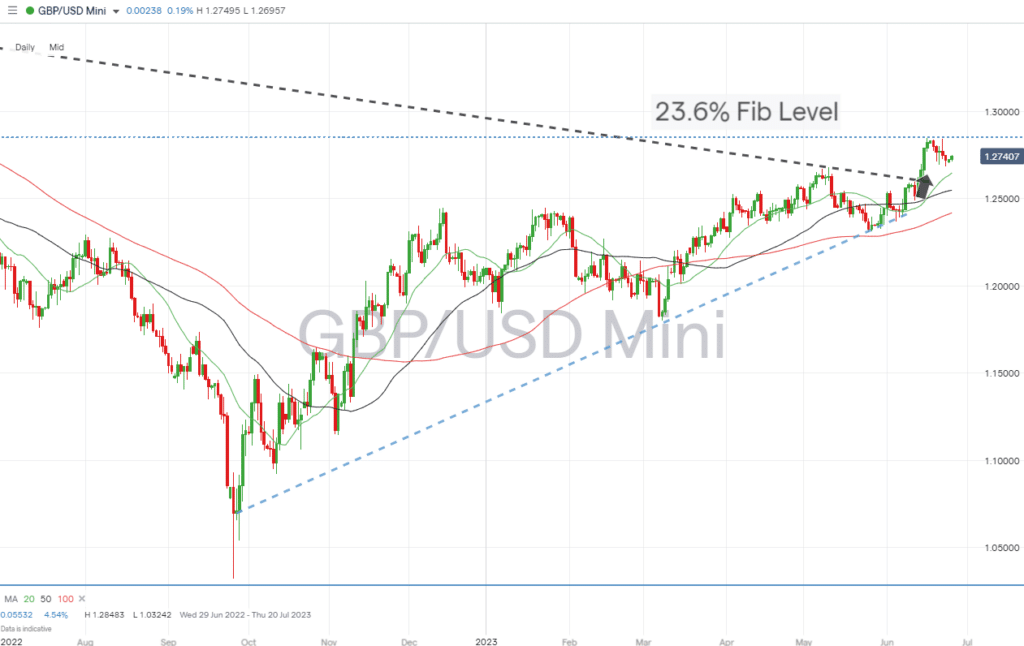
Last week’s 50 basis point hike in UK interest rates surprised many in the markets. Prior to the announcement, it was estimated 50% of analysts were predicting the Bank of England would post a rise of 25 basis points. The absence of a subsequent bounce in the price of GBPUSD suggests deep-seated fears about the health of the UK economy are so far counteracting the appeal of a higher interest rate.
Daily Price Chart – GBPUSD Chart – Daily Price Chart – Fib Level Resistance
Source: IG
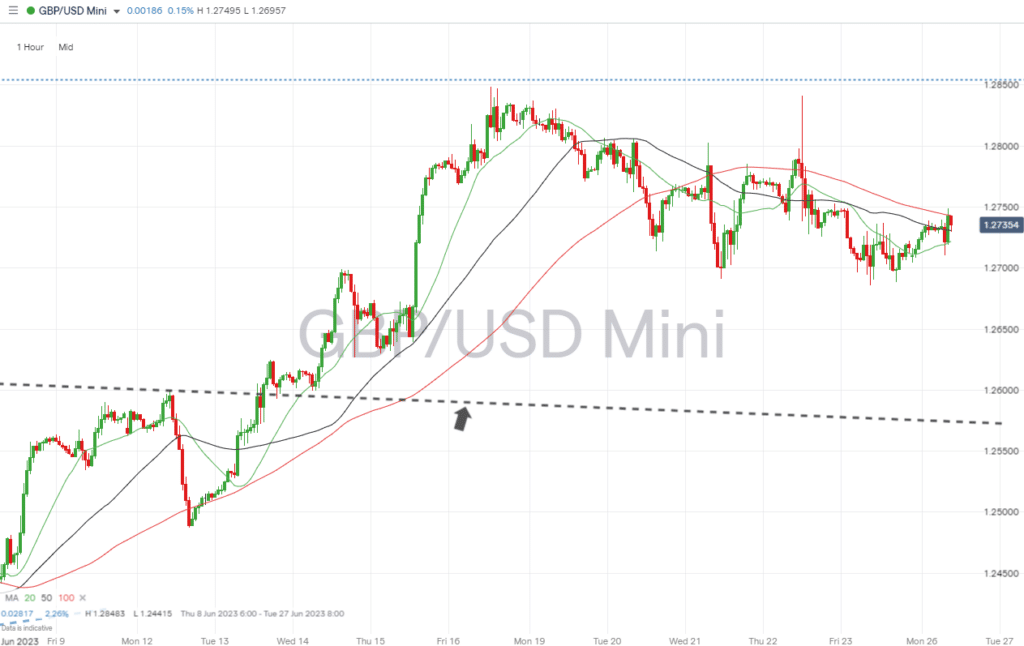
GBPUSD Chart – Hourly Price Chart
Source: IG
Short positions
- Entry Level 1: 1.27431 – Region of the 100 SMA on the Daily Price Chart.
- Price Target 1: 1.2560 – Region of the downward trendline, which dates back to June 2021, which previously acted as resistance but could now support the price of GBPUSD.
- Price Target 2: 1.24182 – Support level formed by the 100 SMA on the Daily Price Chart.
- Stop Loss: > 1.28539 – The 23.6% Fibonacci retracement level of the multi-year downward price move from November 2007 to September 2022.
Long positions
- Entry Level 1: 1.28539 – Applying a momentum based strategy to capture an upward move through the 23.6% Fib level, should the impact of the 50 basis point interest rate rise feed into price levels.
- Price Target 1: 1.300 – Psychologically important ‘round number’ price level.
- Stop Loss: < 1.27222 – Convergence of the 20, 50, and 100 SMAs on the Daily Price Chart.
EURUSD
The convergence of the 20, 50, and 100 SMAs on the Daily Price Chart means a considerable support level has formed in the region of 1.0839 – 1.08513. At the other end of the current price channel, any upward price move would have to work through resistance offered by the psychologically important 1.10 price level and the year-to-date price high of 1.10918 recorded in May.
EURUSD Chart – Daily Price Chart
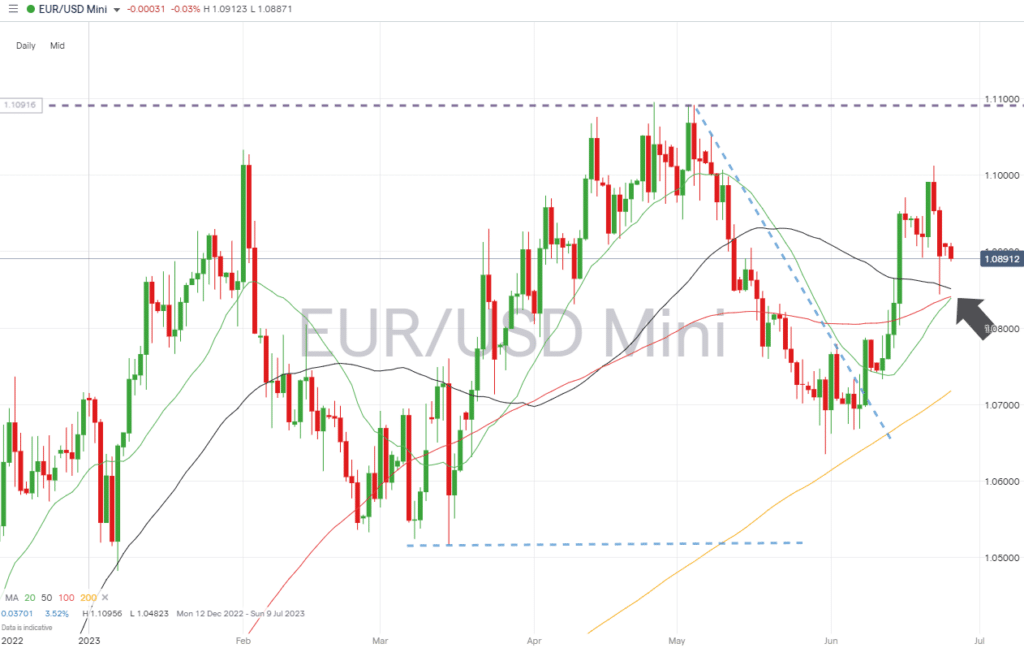
Source: IG
EURUSD Chart – Hourly Price Chart
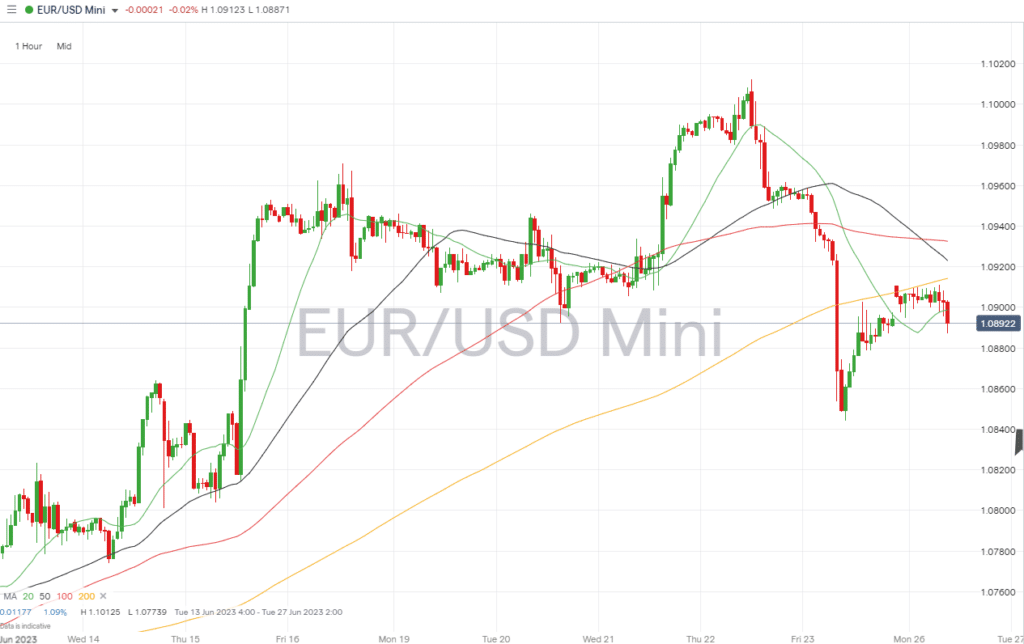
Source: IG
Short positions
- Entry Level 1: 1.10125 – Intraday price high of Thursday 22nd June.
- Price Target 1: 1.08443 – Low price of the week of 19th June and region of 20, 50, and 100 SMAs on the Daily Price Chart.
- Price Target 2: 1.06351 – In extension, swing-low recorded on 31st May. A break of this would signal the market has turned bearish on a daily timeframe.
- Stop Loss: > 1.10918 – Year-to-date high recorded on 4th May.
Long positions
- Entry Level 1: 1.08514 – Buying into any price weakness that brings the trio of SMAs on the Daily Price Chart into play.
- Price Target 1: 1.10125 – June month-to-date price high of Thursday 22nd June. Region of the 1.10 ‘round number’ resistance level.
- Price Target 2: 1.10918 – In extension, year-to-date price high.
- Stop Loss: < 1.07122 – Region of the 200 SMA on the Daily Price Chart.
Indices
S&P 500
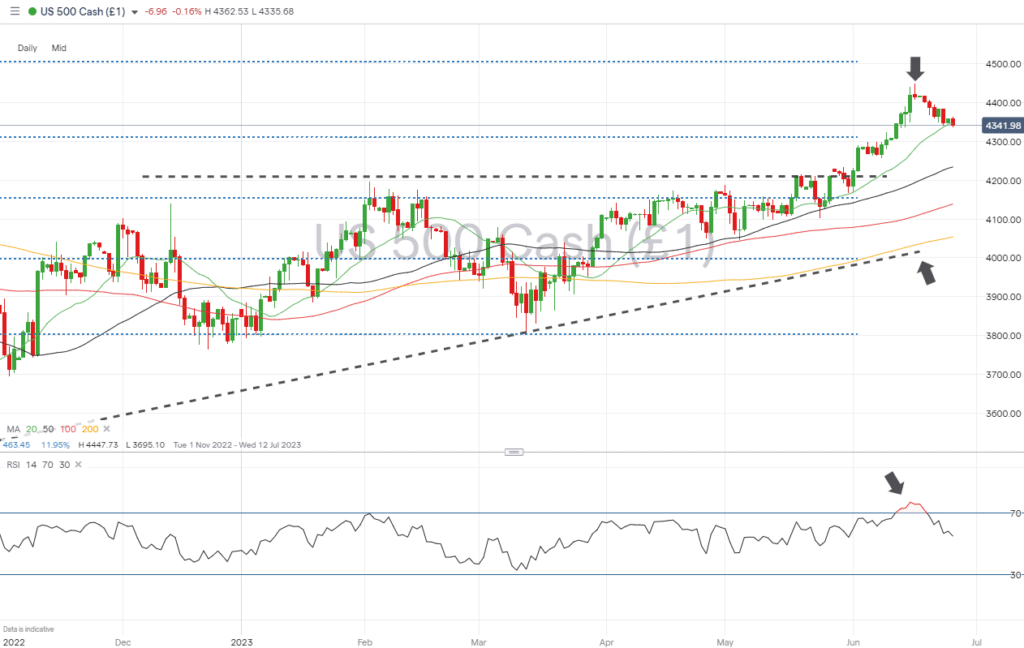
The high reading of the RSI on the Daily Price Chart identified in last week’s report correctly tied in with an easing in stock prices. That doesn’t necessarily signal the end of the bull market, which began in October 2022, but in a quiet news week, price moves could trend sideways as part of an extended consolidation price pattern.
S&P 500 Chart – Daily Price Chart
Source: IG
S&P 500 – Hourly Price Chart
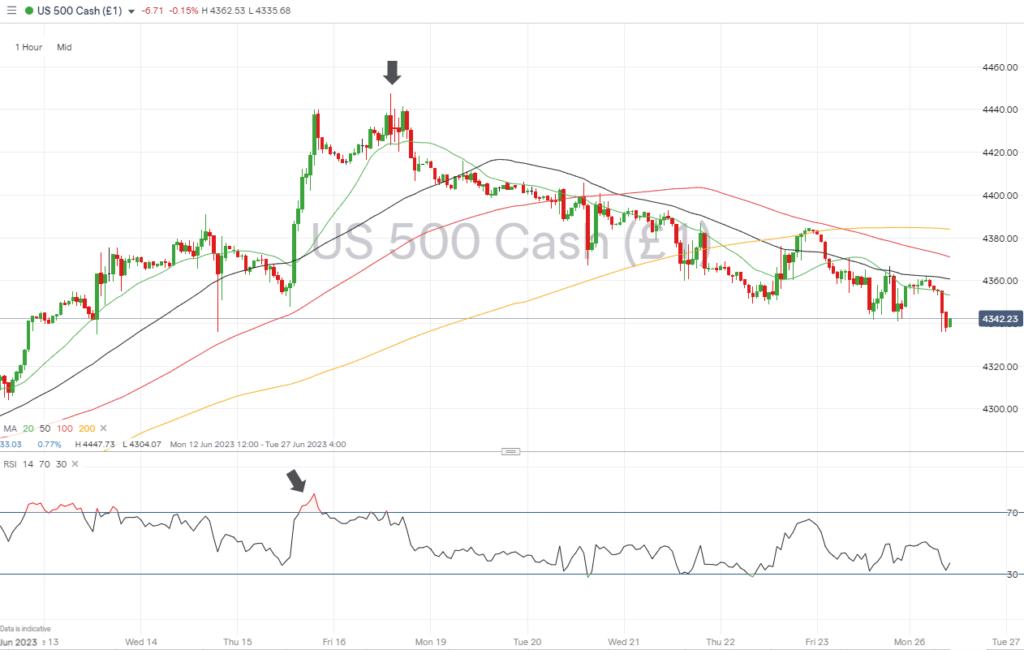
Source: IG
Short positions
- Entry Level 1: 4,447 – The current year-to-date high, which sits beneath the psychologically important 4,500 price bar and the 61.8% Fibonacci retracement level of the price fall from 4th January to 13th October 2022.
- Price Target 1: 4,346 – Region of the 20 SMA on the Daily Price Chart.
- Price Target 2: 4,193 – In extension, Region of the 50 SMA on the Daily Price Chart, and 50% retracement level of the Jan-Oct 2022 Fib price pattern (4153).
- Price Target 3: 4,054 – In extension, region of the 200 SMA on the Daily Price Chart. Trendline and ‘round number’ support can be expected in the region of 4,000.
- Stop Loss: > 4,637 – Price high of 26th March 2022.
Long positions
- Entry Level 1: 4,346 – Buying into any short-term weakness which takes price towards the region of the 20 SMA on the Daily Price Chart.
- Price Target 1: 4,447 – June month-to-date price high, printed on Friday 16th June.
- Stop Loss: < 4,207 – Region of the 50 SMA on Daily Price Chart (4,230) and resistance/support level which guided price between February and May.
Crypto – Bitcoin & Ethereum
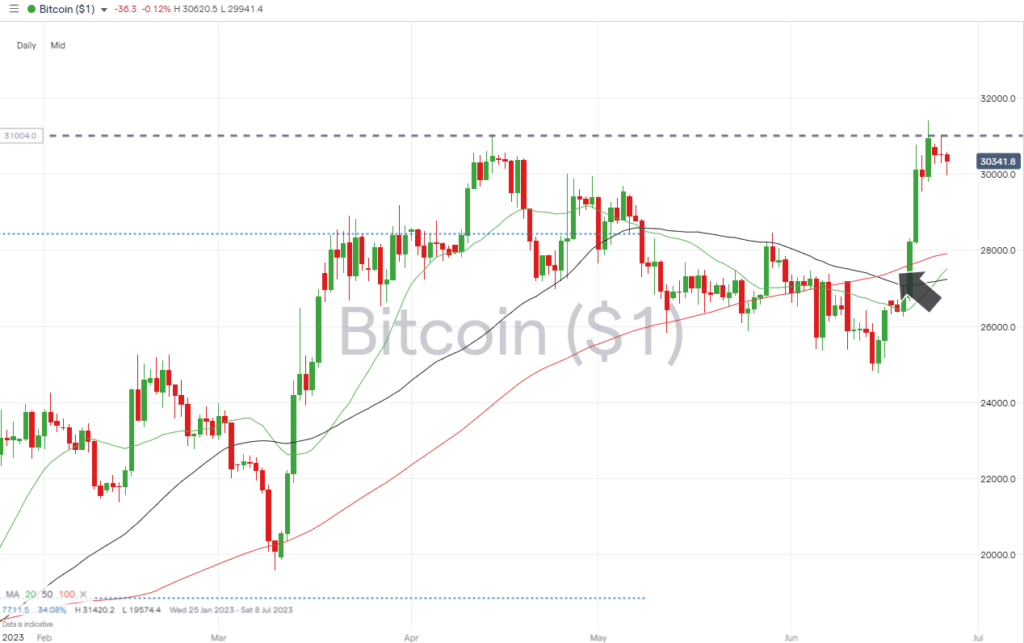
Both major cryptos posted bumper weeks on the back of hints that US regulators may be considering taking a more accommodating approach to the market. Bitcoin posted a weekly gain of +15%, with Ether following suit and increasing in value by more than 10%. If upward momentum continues to build, both coins could be about to test the current year-to-date highs.
Bitcoin Price Chart – Daily Price Chart
Source: IG
Bitcoin Long positions
- Entry Level 1: 31,036 – A break of the previous year-to-date price high recorded on 14th April would signal upward momentum continuing to build.
- Price Target 1: 36,180 – 50% Fib retracement level of the bull run between March 2019 and November 2021.
- Stop Losses: < 27,915 – Region of the 100 SMA on the Daily Price Chart, with the 20 and 50 SMAs providing additional support at 27,510 and 27,239, respectively.
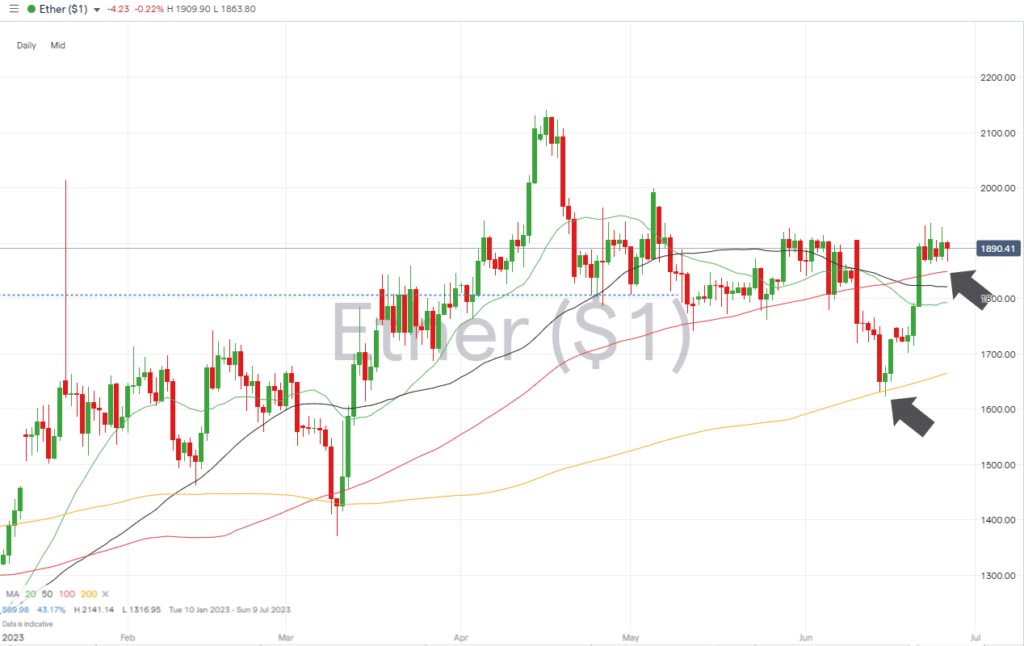
Ethereum
Ethereum Chart – Daily Price Chart
Source: IG
Ethereum Long positions
- Entry Level 1: 1,849 – Buying into short-term weakness which takes price to the level of the 50 SMA on the Daily Price Chart.
- Price Target 1: 2,000 – Psychologically important support/resistance level last tested on 5th May.
- Price Target 2: 2,141 – In extension, the year-to-date price high printed on 16th April.
- Stop Losses: < 1,806 – Marks the 23.6% Fib retracement price level of the 2022 price crash.
Risk Statement: Trading financial products carries a high risk to your capital, especially trading leverage products such as CFDs. They may not be suitable for everyone. Please make sure that you fully understand the risks. You should consider whether you can afford to risk losing your money.

Forextraders' Broker of the Month
BlackBull Markets is a reliable and well-respected trading platform that provides its customers with high-quality access to a wide range of asset groups. The broker is headquartered in New Zealand which explains why it has flown under the radar for a few years but it is a great broker that is now building a global following. The BlackBull Markets site is intuitive and easy to use, making it an ideal choice for beginners.