
FOCUS ON: Non-Farm Payrolls Jobs Report
- US Jobs numbers due out Friday
- Trading week curtailed by US 4th of July holiday
- Markets could continue in current patterns before US jobs numbers offer insight into health of world’s most important economy
Trading Ideas
We created this Weekly Tips section to share possible trade entry and exit points based on our technical analysis. We also have other methods to validate our trades which we can’t publicly share that help to increase their success. All our trades include entry and at least one target price. Stop losses are applied at the reader’s discretion. Our strategies typically trade with a wide stop loss, and risk is further mitigated by trading in small sizes.
Instrument | Price | Hourly | Daily |
GBP/USD | 1.2666 | Strong Sell | Neutral |
EUR/USD | 1.0879 | Strong Sell | Neutral |
USD/JPY | 144.78 | Strong Buy | Strong Buy |
S&P 500 | 4,450 | Strong Buy | Strong Buy |
NASDAQ 100 | 15,205 | Strong Buy | Strong Buy |
FTSE100 | 7,550 | Strong Buy | Neutral |
Gold | 1,913 | Strong Sell | Strong Sell |
Crude Oil WTI | 70.49 | Neutral | Neutral |
Bitcoin | 30,690 | Strong Buy | Buy |
Ethereum | 1,923 | Strong Buy | Strong Buy |
UTC: 09:43
US Dollar Basket Index (DXY)
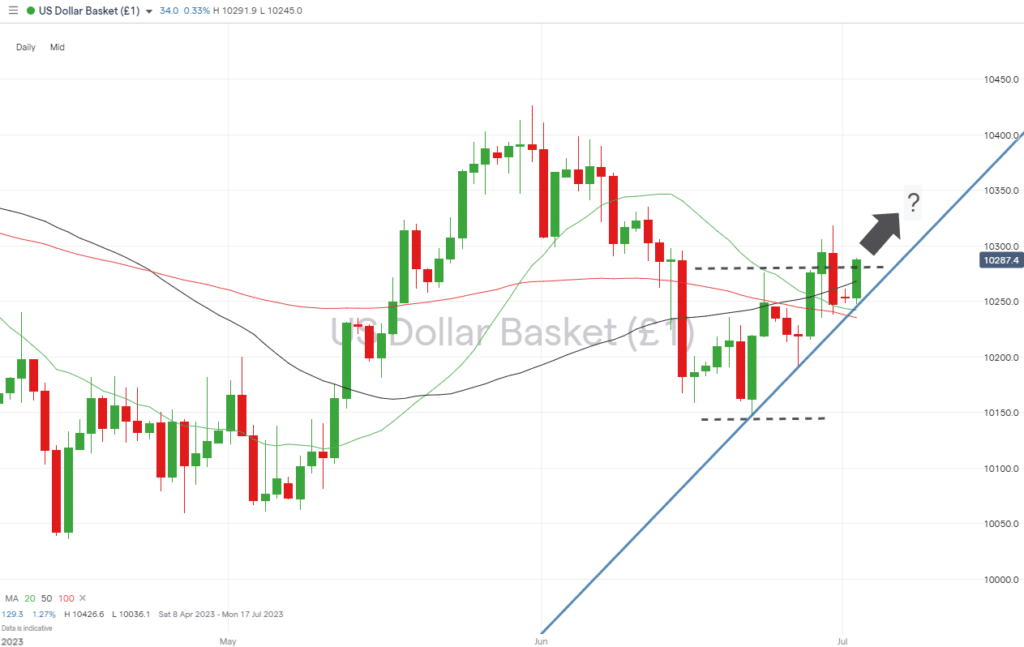
Comments made last week by Fed Chair Jerome Powell reaffirmed the FOMC’s hawkish approach to interest rate policy looks set to remain in place. Major currency pairs that had posted two weeks of range-bound trading haven’t confirmed an upside break out of that channel. However, unless the NFP jobs report on Friday reveals a serious decline in US economic activity, higher rates and dollar strength could be the dominant theme for the coming weeks.
US Dollar Basket Chart – Daily Price Chart – Breakout?
Source: IG
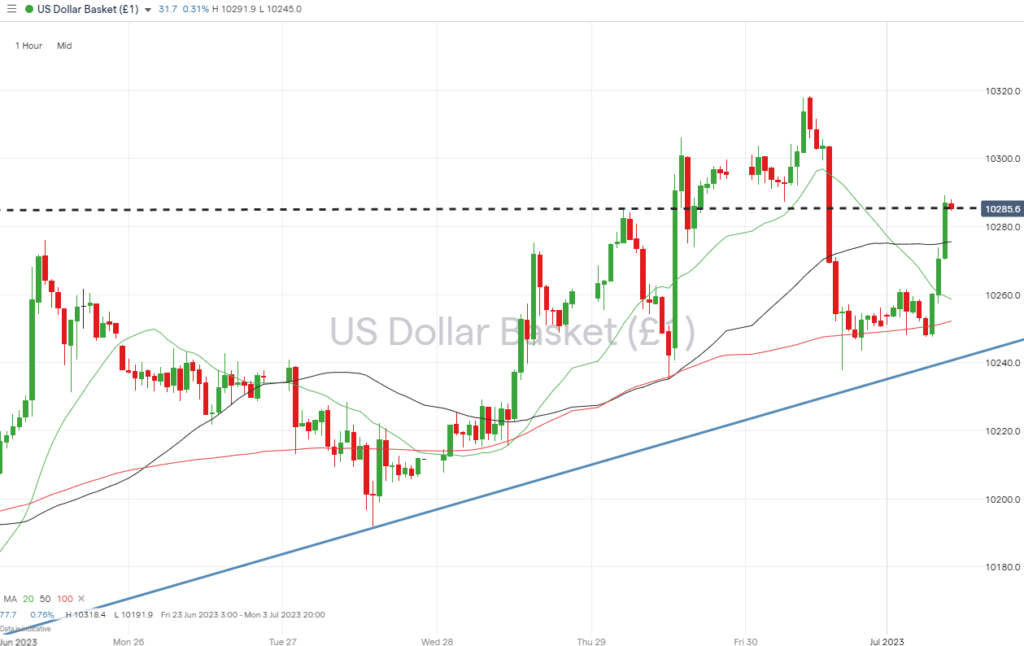
US Dollar Basket Chart – Hourly Price Chart
Source: IG
Short positions
- Entry Level 1: 102.76 – The price highs of 23rd June and 28th June (102.78) mark the top of the multi-week trading range, which the DXY index has spent the last three trading sessions trying to break out of. A return to below this resistance/support level could confirm that the upward breakout has failed and downward momentum is building.
- Price Target 1: 102.41 – Region of the 20 SMA on the Daily Price Chart and the supporting trendline dating from 22nd June.
- Price Target 2: 101.47 – Month-to-date price low recorded on 22nd June. Bottom of the sideways trading channel.
- Stop Loss: > 103.18 – Price high of Friday 30th June.
Long positions
- Entry Level 1: 102.76 – The 23rd / 28th June resistance/support level could also be used as a buying opportunity if short-term weakness takes price into the region of 102.76 – 102.78.
- Price Target 1: 103.18 – Intraday price high of Friday 30th June.
- Price Target 2: 104.26 – In extension, four-month price high printed on 31st May.
- Stop Loss: < 102.68 – Region of the 50 SMA on the Daily Price Chart.
GBPUSD
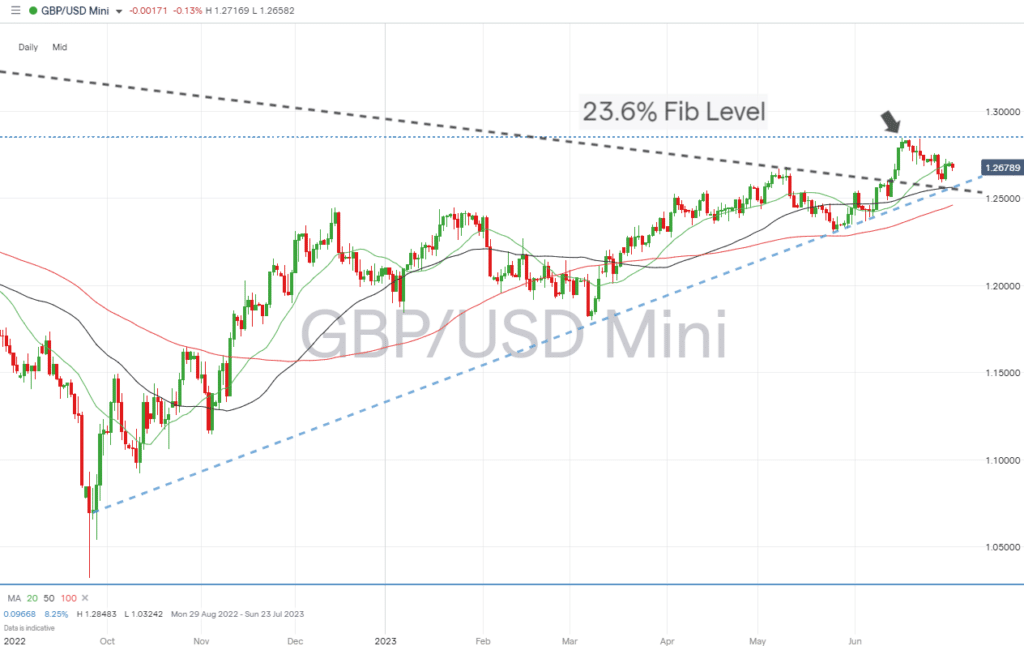
The 23.6% Fibonacci retracement level of the multi-year downward price move from November 2007 to September 2022 provides considerable resistance to further upward price moves in GBPUSD. The hawkish comments made by Powell last week were followed by a downward trend forming in the cable currency pair, and despite the Bank of England’s concerns about inflation, the path of least resistance appears to be downward.
Daily Price Chart – GBPUSD Chart – Daily Price Chart – Fib Level Resistance
Source: IG
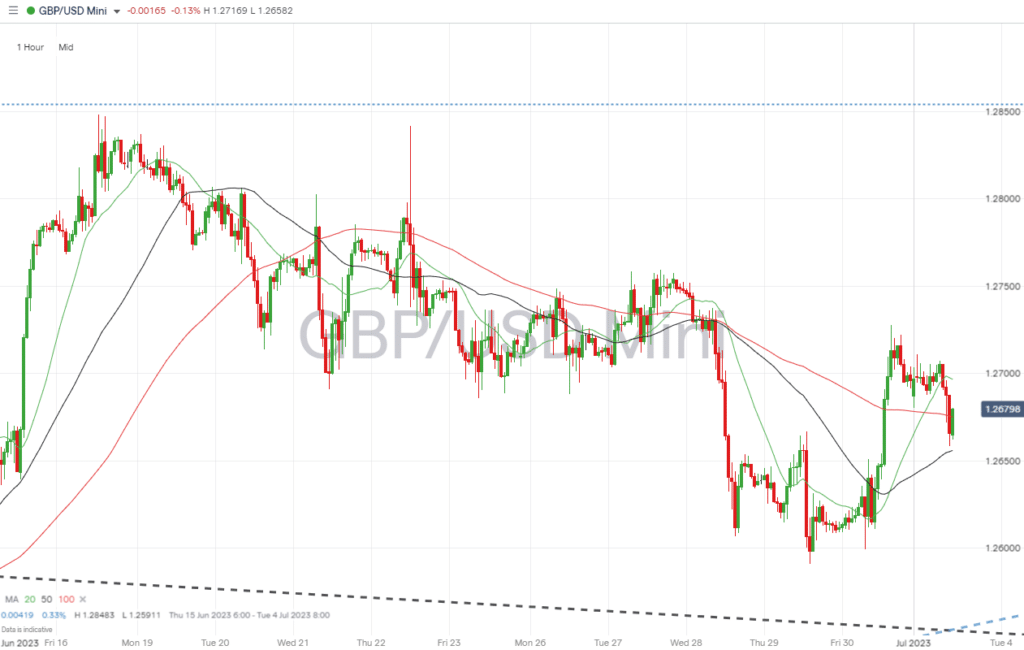
GBPUSD Chart – Hourly Price Chart
Source: IG
Short positions
- Entry Level 1: 1.27051 – Region of the 20 SMA on the Daily Price Chart.
- Price Target 1: 1.2560 – Region of the convergence of the upward and downward trendlines and the 50 SMA on the Daily Price Chart.
- Price Target 2: 1.23081 – Swing-low price pattern formed on 25th May.
- Stop Loss: > 1.28539 – The 23.6% Fibonacci retracement level of the multi-year downward price move from November 2007 to September 2022.
Long positions
- Entry Level 1: 1.2560 – With the RSI on the Daily Price Chart trading mid-range (52.5), there is every possibility that price could rally. The region of the convergence of the upward and downward trendlines and the 50 SMA on the Daily Price Chart will offer an entry point for those looking to go long GBPUSD.
- Price Target 1: 1.27051 – 20 SMA on the Daily Price Chart.
- Price Target 2: 1.28539 – As price has failed several times to break through the 23.6% Fib level, that region of resistance would appear a good place to lock in profits on long positions.
- Stop Loss: < 1.24613 – Region of the 100 SMA on the Daily Price Chart. Price hasn’t closed below that metric since 16th March.
EURUSD
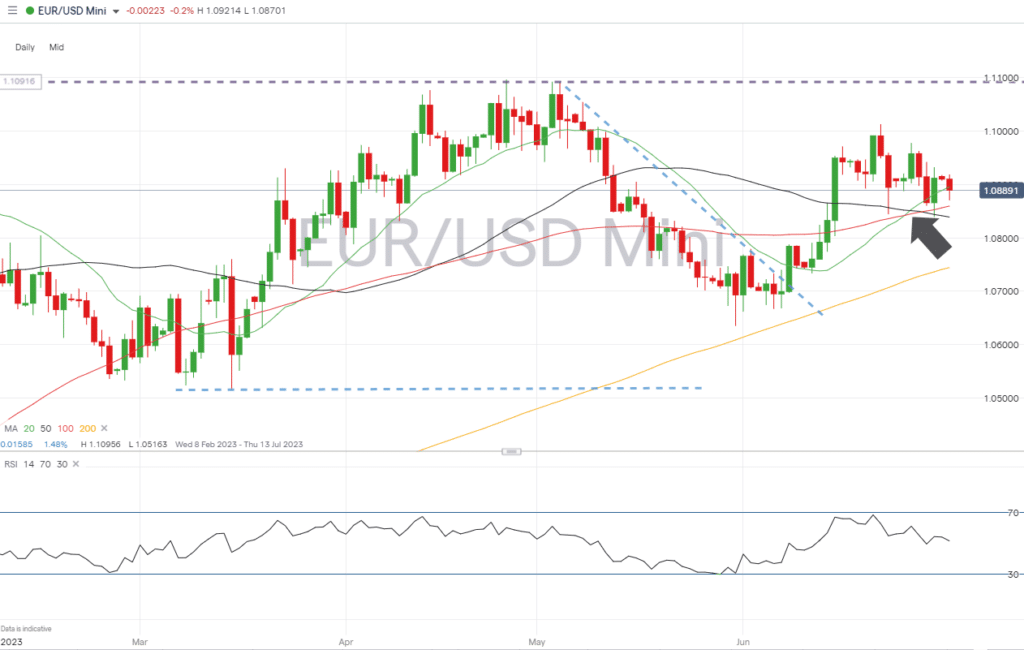
Like the GBPUSD currency pair, EURUSD has a mid-range RSI on the Daily Price Chart of 51.3. That leaves room for price to move in either direction on that time frame, and with the US holiday on Tuesday, it might be a case of the markets waiting for the US employment data to be released on Friday before moving with any conviction.
EURUSD Chart – Daily Price Chart
Source: IG
EURUSD Chart – Hourly Price Chart
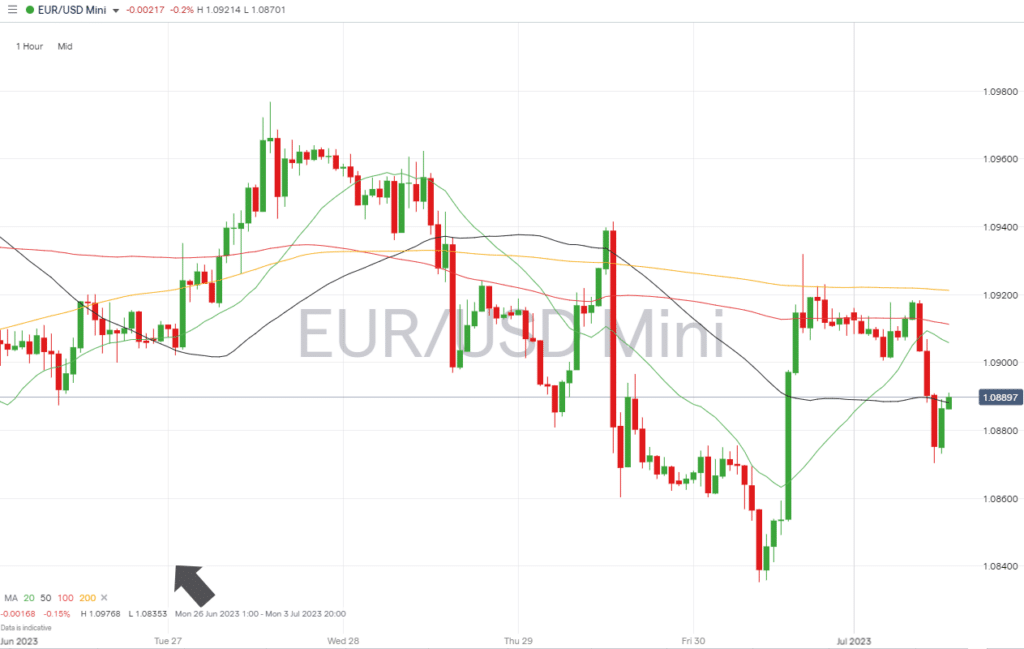
Source: IG
Short positions
- Entry Level 1: 1.10125 – Given the hawkish tone of Jerome Powell’s recent speech, any move to test the price high recorded on Thursday 22nd June would be an invitation to short EURUSD.
- Price Target 1: 1.08954 – Region of the 20 SMA on the Daily Price Chart.
- Price Target 2: 1.08821 – Intraday price low printed on 30th June, which bounced off the 50 SMA on the Daily Price Chart.
- Stop Loss: > 1.10918 – Year-to-date high recorded on 4th May.
Long positions
- Entry Level 1: 1.08821 – A retreat to the price low printed on 30th June would open the door to going long EURUSD just above the location of the 50 SMA on the Daily Price Chart.
- Price Target 1: 1.10125 – June month-to-date price high of Thursday 22nd June. Just above the 1.10 ’round number’ resistance level.
- Price Target 2: 1.10918 – In extension, the year-to-date price high recorded in May.
- Stop Loss: < 1.07442 – Region of the 200 SMA on the Daily Price Chart.
Indices
S&P 500
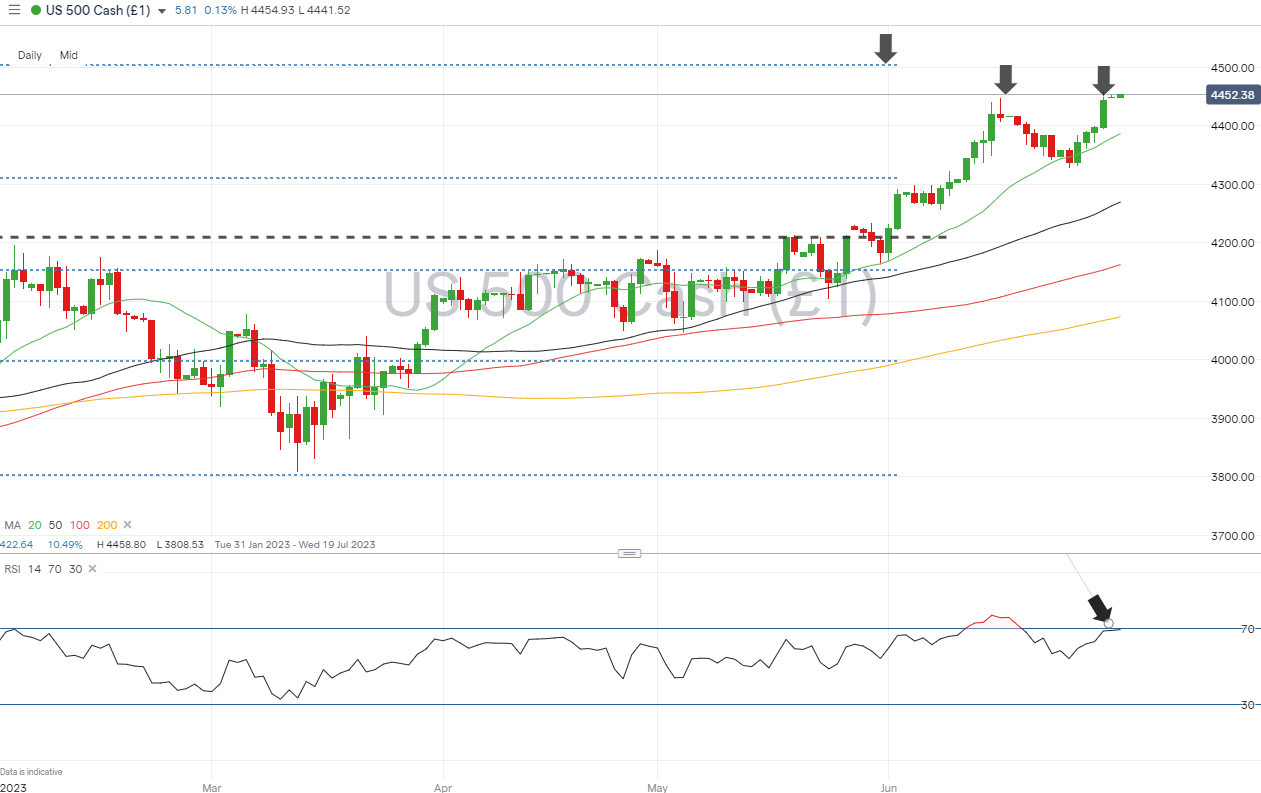
Since March, the world’s most important stock index has formed a price pattern that can only be described as bullish. With a relatively quiet news calendar in place until Friday, some might be tempted to buy into short-term price weakness. There is, however, resistance to further upward price movement. The 61.8% Fibonacci retracement level of the price fall from 4th January to 13th October 2022 sits at 4,504, and there is also a potential double top forming in the region of 4,447. With the RSI on the Daily Price Chart generating a reading of 69.6, the air does currently appear to be getting thin for US stocks.
S&P 500 Chart – Daily Price Chart
Source: IG
S&P 500 – Hourly Price Chart
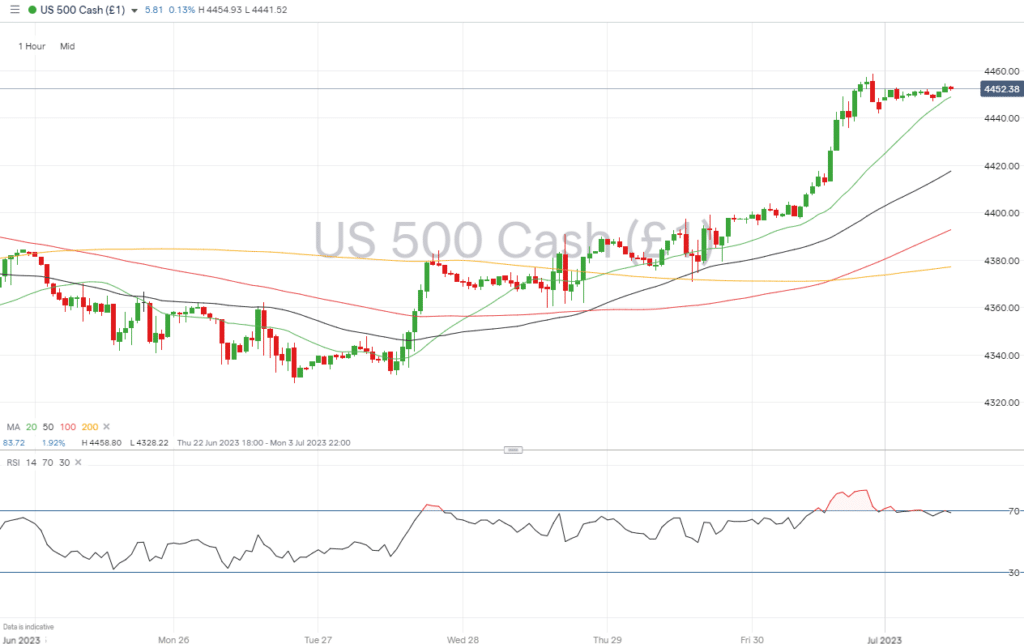
Source: IG
Short positions
- Entry Level 1: 4,447 – The previous year-to-date high recorded on 16th June sits beneath the psychologically important 4,500 price bar and the 61.8% Fibonacci retracement level of the price fall from 4th January to 13th October 2022. A break of the 4,447 level could indicate that all that resistance is currently too strong for further upward price movement.
- Price Target 1: 4,386 – Region of the 20 SMA on the Daily Price Chart.
- Price Target 2: 4,269 – In extension, Region of the 50 SMA on Daily Price Chart.
- Price Target 3: 4,504 – 50% retracement level of the Jan-Oct 2022 Fib price pattern.
- Stop Loss: > 4,637 – Price high of 26th March 2022.
Long positions
- Entry Level 1: 4,386 – Buying into any short-term weakness which takes price towards the region of the 20 SMA on the Daily Price Chart. That metric has proven to be a reliable indicator since 5th May
- Price Target 1: 4,447 – Price high, printed on Friday 16th June.
- Price Target 2: 4,269 – 61.8% Fibonacci retracement level of the price fall from 4th January to 13th October 2022
- Stop Loss: < 4,200 – Trendline support and mid-range point of the 50 and 100 SMAs on the Daily Price Chart.
Crypto – Bitcoin & Ethereum
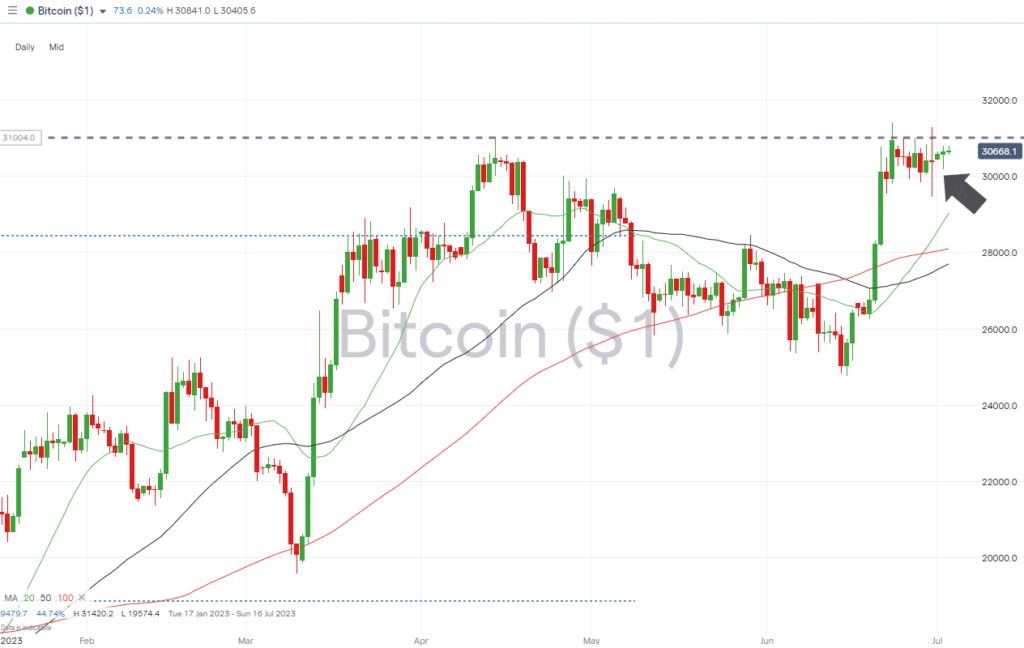
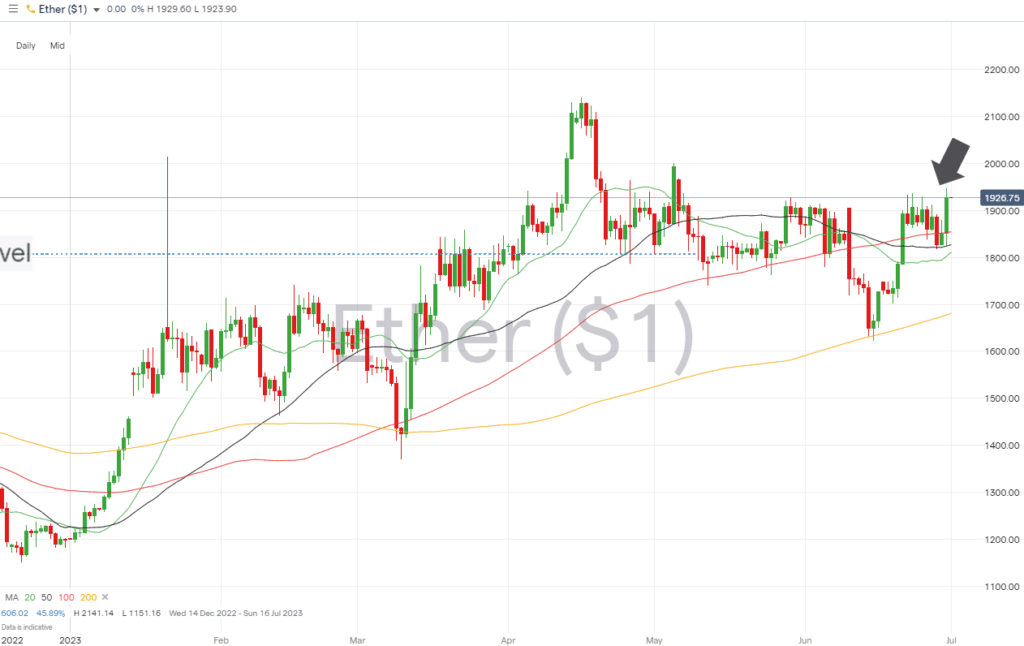
Although Ethereum and Bitcoin traded sideways last week, crypto bulls will take comfort from the coins managing to consolidate in the region of key resistance levels. Bitcoin’s week-on-week price gain was 0.72%, and Ethereum’s was 1.48%. Those price moves are relatively small compared to historical volatility levels, but a break of key resistance levels could signal a new bull run forming.
Bitcoin Price Chart – Daily Price Chart
Source: IG
Bitcoin Long positions
- Entry Level 1: 31,036 – A confirmed break of the previous year-to-date price high recorded on 14th April would signal upward momentum is continuing to build.
- Price Target 1: 36,180 – 50% Fib retracement level of the bull run between March 2019 and November 2021.
- Stop Losses: < 29,033 – Region of the 20 SMA on the Daily Price Chart.
Ethereum
Ethereum Chart – Daily Price Chart
Source: IG
Ethereum Long positions
- Entry Level 1: 1,854 – Buying into short-term weakness, which takes price to the level of the 100 SMA on the Daily Price Chart.
- Price Target 1: 2,000 – Psychologically important ’round number’ support/resistance level was last tested on 5th May.
- Price Target 2: 2,141 – In extension, the year-to-date price high printed on 16th April.
- Stop Losses: < 1,806 – Marks the 23.6% Fib retracement price level of the 2022 price crash.
Risk Statement: Trading financial products carries a high risk to your capital, especially trading leverage products such as CFDs. They may not be suitable for everyone. Please make sure that you fully understand the risks. You should consider whether you can afford to risk losing your money.

Forextraders' Broker of the Month
BlackBull Markets is a reliable and well-respected trading platform that provides its customers with high-quality access to a wide range of asset groups. The broker is headquartered in New Zealand which explains why it has flown under the radar for a few years but it is a great broker that is now building a global following. The BlackBull Markets site is intuitive and easy to use, making it an ideal choice for beginners.