
FOCUS ON: Macroeconomic Themes Create Uncertainty
- Non-Farm Payroll data brings uncertainty to financial markets
- US-China talks and upcoming inflation data add to macroeconomic tensions
- Forex and stock markets poised at key support levels
Trading Ideas
We created this Weekly Tips section to share possible trade entry and exit points based on our technical analysis. We also have other methods to validate our trades which we can’t publicly share that help to increase their success. All our trades include entry and at least one target price. Stop losses are applied at the reader’s discretion. Our strategies typically trade with a wide stop loss, and risk is further mitigated by trading in small sizes.
Instrument | Price | Hourly | Daily |
GBP/USD | 1.2814 | Neutral | Strong Buy |
EUR/USD | 1.0952 | Neutral | Strong Buy |
USD/JPY | 142.28 | Strong Sell | Sell |
S&P 500 | 4,383 | Strong Sell | Buy |
NASDAQ 100 | 14,964 | Sell | Buy |
FTSE100 | 7,255 | Strong Sell | Strong Sell |
Gold | 1,924 | Neutral | Sell |
Crude Oil WTI | 73.16 | Neutral | Strong Buy |
Bitcoin | 30,074 | Sell | Sell |
Ethereum | 1,854 | Sell | Strong Sell |
UTC: 09:32
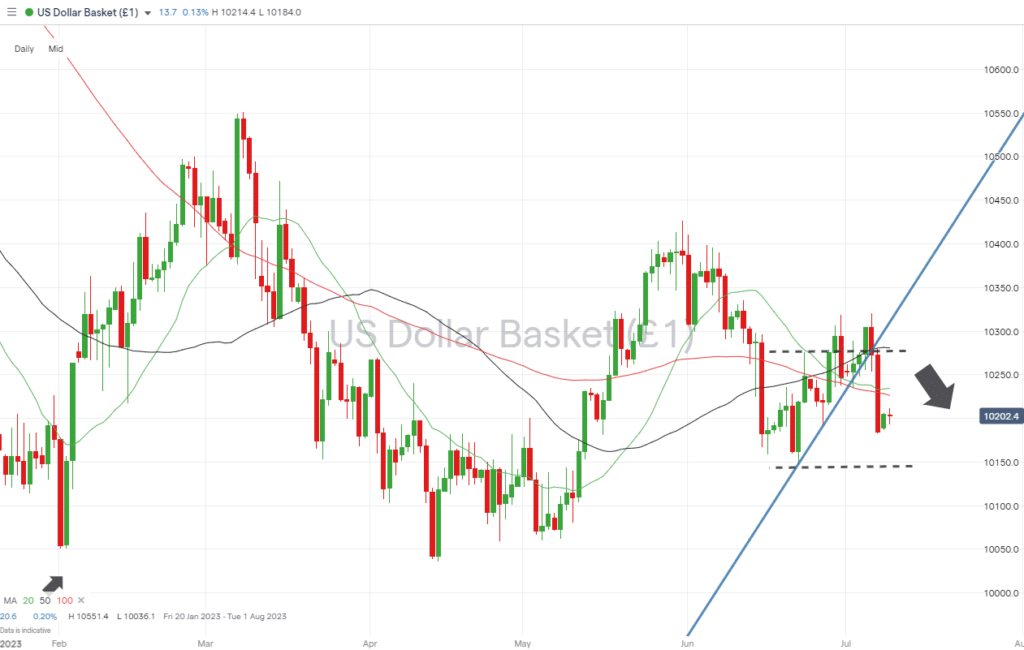
US Dollar Basket Index (DXY)
Underlying macroeconomic themes continue to dominate the forex markets. Friday’s worse-than-expected US Non-Farm Payrolls number could trigger a more dovish approach to interest rates by the US Federal Reserve. At the same time, US Treasury Secretary Janet Yellen’s tour of China appears to be highlighting rather than resolving tensions between the US and China
US Dollar Basket Chart – Daily Price Chart – Trendline break
Source: IG
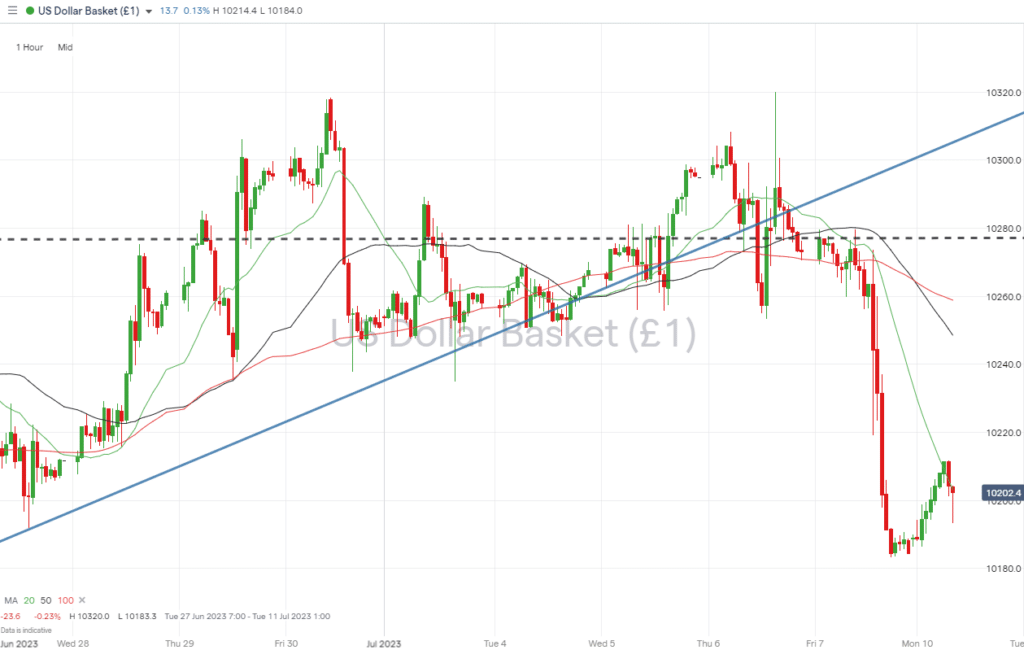
US Dollar Basket Chart – Hourly Price Chart
Source: IG
Short positions
- Entry Level 1: 102.26 – Selling into short-term strength, which takes price into the range where the 20 and 100 SMAs have converged.
- Price Target 1: 101.83 – Intraday low of Friday 7th July.
- Price Target 2: 101.47 – Price low recorded on 22nd June. Bottom of the sideways trading channel, which dominated price action during the second half of that month.
- Price Target 3: 100.00 – In extension, parity price level.
- Stop Loss: > 103.18 – Price high of Friday 30th June, and region of the trendline formed between 22nd June and 6th July.
Long positions
- Entry Level 1: 101.47 – With upward momentum draining out of the market, those looking to go long on the dollar might wait until the price retreats to the bottom of the sideways trading channel that dominated price action during the second half of June.
- Price Target 1: 102.26 – Convergence of 20 and 100 SMA’s.
- Price Target 2: 102.76 – Price highs of 23rd / 28th June mark the upper end of that sideways channel.
- Stop Loss: < 101.47 – Tight stop-loss. Few technical support levels are below the trade entry point, leaving room for price to fall or even be drawn to the parity price level of 1.000.
GBPUSD
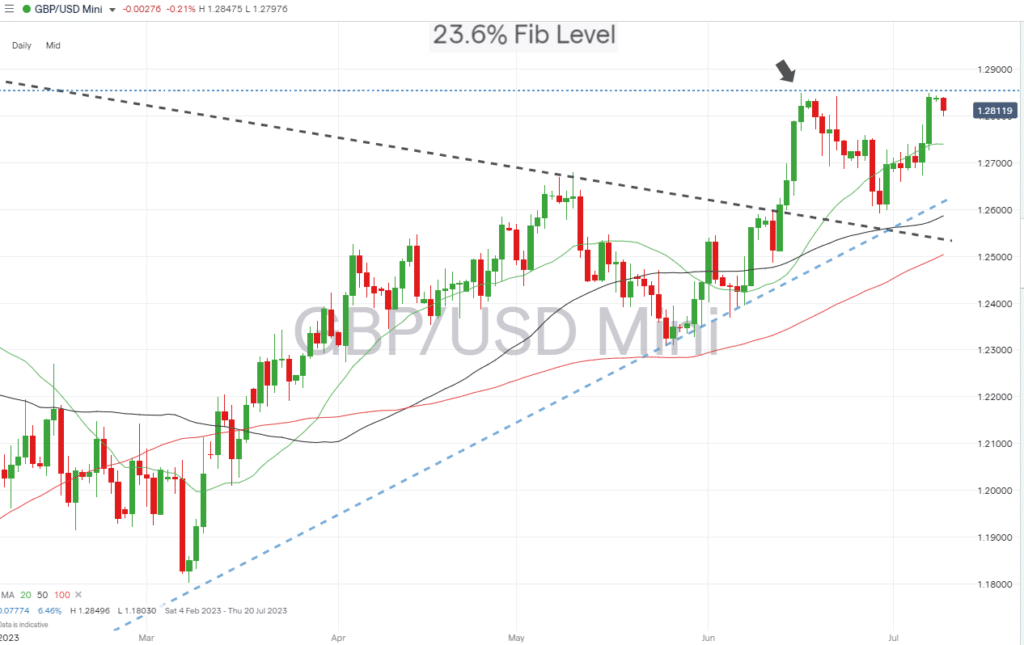
The 23.6% Fibonacci retracement level of the multi-year downward price move from November 2007 to September 2022 continues to provide resistance to further upward price moves in GBPUSD. With the RSI on the Daily Price Chart at 62.80, there is room for a test and break of that level before the market becomes oversold.
Daily Price Chart – GBPUSD Chart – Daily Price Chart – Fib Level Resistance
Source: IG
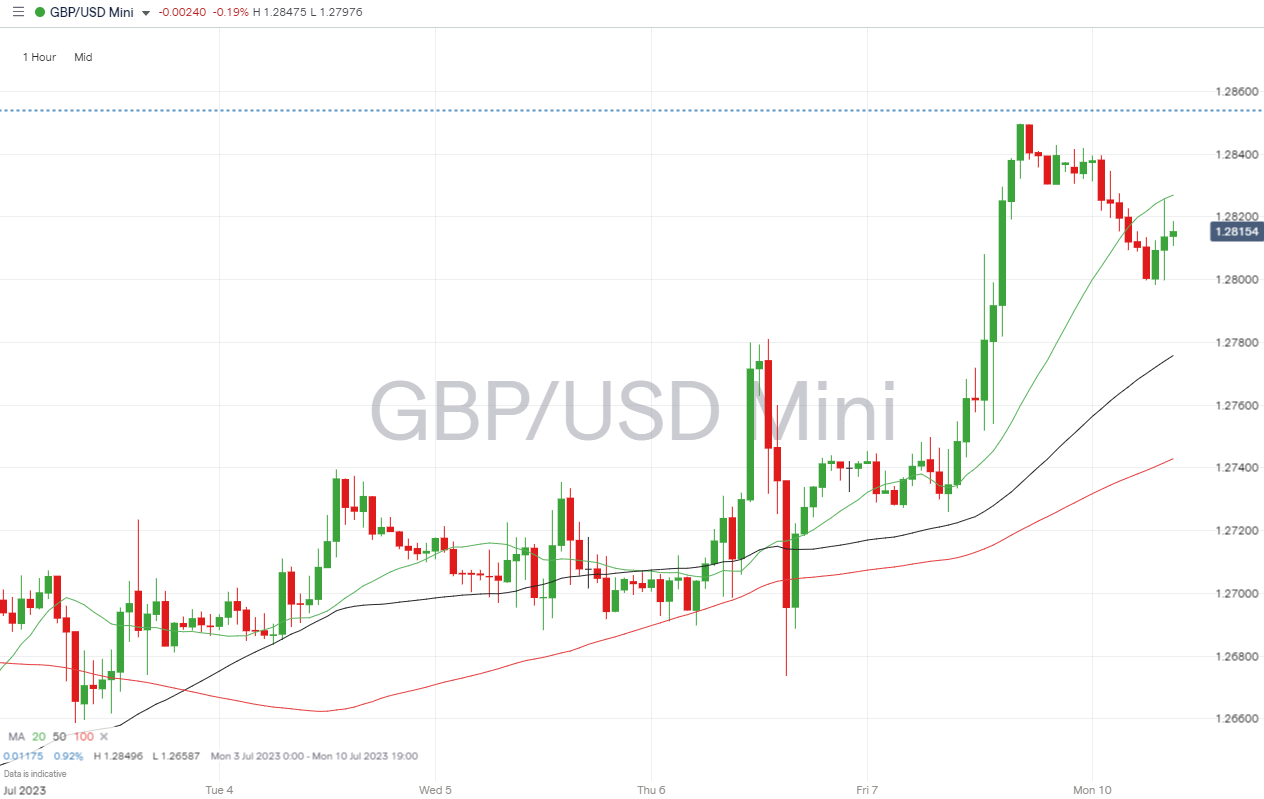
GBPUSD Chart – Hourly Price Chart
Source: IG
Short positions
- Entry Level 1: 1.28539 – Major resistance in the form of the 23.6% Fib retracement level.
- Price Target 1: 1.27397 – Region of the 20 SMA on the Daily Price Chart.
- Price Target 2: 1.26205 – Supporting trendline of the bullish trend started in September 2022.
- Stop Loss: 1.2871 – Region of the 50 SMA on the Monthly Price Chart. There are few resistance levels above the Fib retracement, which suggests using tight stop losses would be appropriate and avoid the risk of getting caught on the wrong side of a significant up-trend.
Long positions
- Entry Level 1: 1.28539 – The 23.6% Fib level also offers a trade entry point for those looking to go long. Applying a momentum-based strategy would require waiting until the break of 1.28539 is confirmed.
- Price Target 1: 1.3000 – Psychologically important, ‘round number’ support level.
- Stop Loss: < 1.27397 – Region of the 20 SMA on the Daily Price Chart.
EURUSD
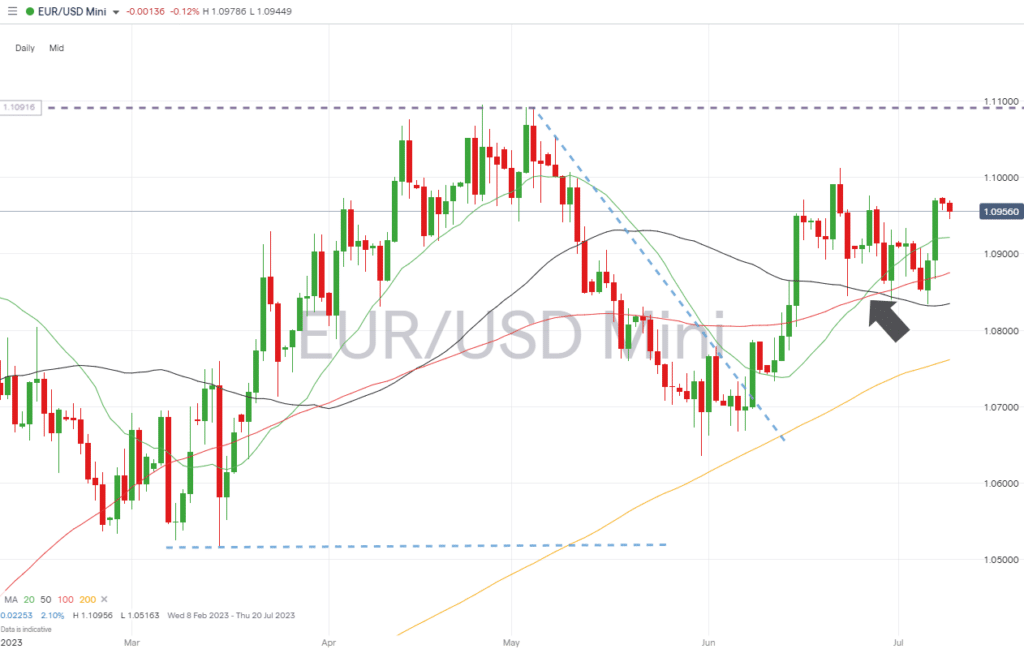
The RSI on the EURUSD Daily Price Chart sits at 57.2, which leaves room for price to move in either direction in that timeframe. The rally on Friday, which followed the US jobs numbers being released, is approaching important technical resistance levels, but geopolitical events could provide enough impetus for those to be broken.
EURUSD Chart – Daily Price Chart
Source: IG
EURUSD Chart – Hourly Price Chart
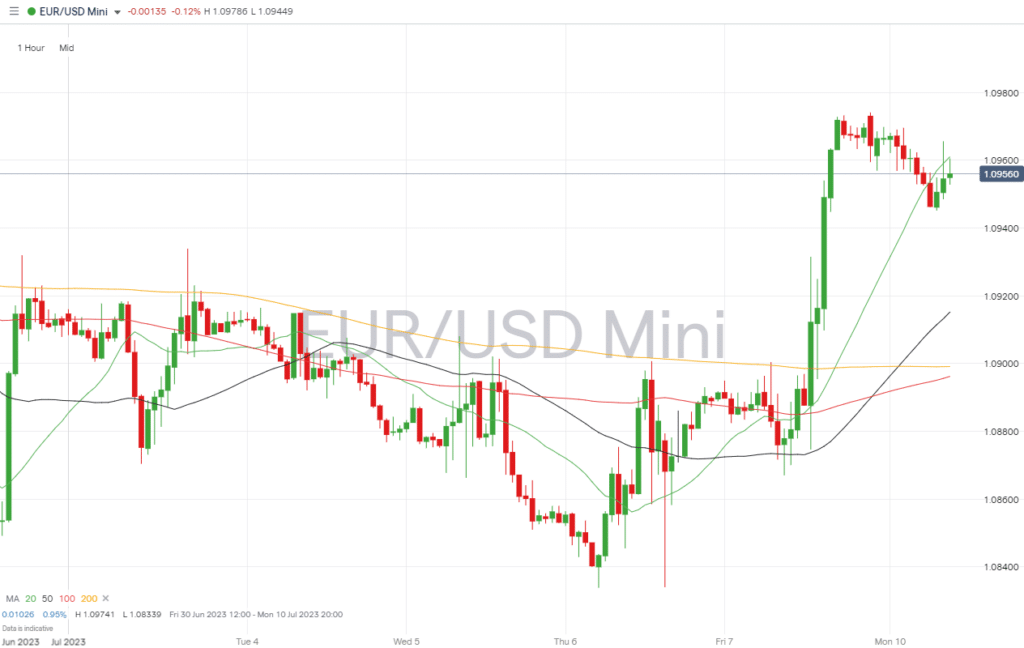
Source: IG
Short positions
- Entry Level 1: 1.10125 – June price high printed on Thursday 22nd June. Just above the 1.10 ‘round number’ resistance level.
- Price Target 1: 1.09216 – Region of the 20 SMA on the Daily Price Chart.
- Price Target 2: 1.08339 – Intraday price low of 6th July and region of the 50 SMA on the Daily Price Chart (1.08348).
- Stop Loss: > 1.10918 – Year-to-date high recorded on 4th May.
Long positions
- Entry Level 1: 1.09216 – Buying into short-term weakness, which takes price to the region of the 20 SMA on the Daily Price Chart.
- Price Target 1: 1.10125 – June month-to-date price high of Thursday 22nd June. Just above the 1.10 ‘round number’ resistance level.
- Price Target 2: 1.10918 – In extension, the year-to-date price high recorded in May.
- Stop Loss: < 1.08348 – 50 SMA on the Daily Price Chart. Price has bounced off this metric on several occasions since 23rd June.
Indices
S&P 500
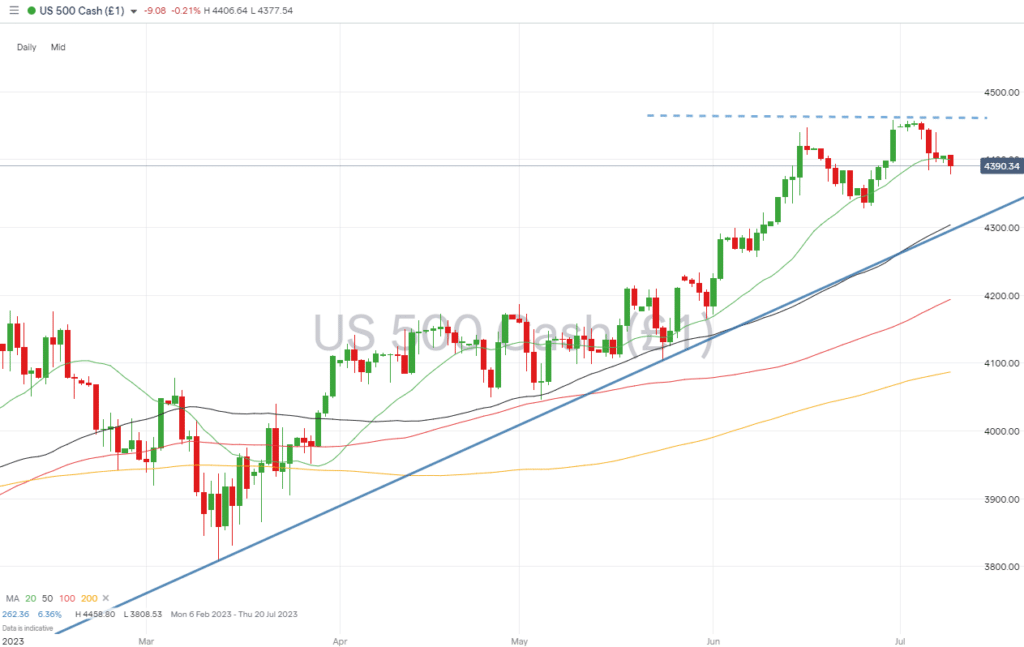
Friday’s US Non-Farm Payroll jobs number suggests the US economy might not be holding up as well as some analysts have expected. Payrolls increased by 209,000 in June, below the consensus estimate of 240,000. That ‘miss’ is only the second time in the last 13 months that the labour market forecast has not been as good as expected. The opinion that weak jobs data could result in the Fed not raising interest rates as hard as it has been doing suggested it should be good for stocks. However, the immediate reaction by the S&P 500 index was a fall in value, bringing US stocks to key technical support levels.
S&P 500 Chart – Daily Price Chart
Source: IG
S&P 500 – Hourly Price Chart
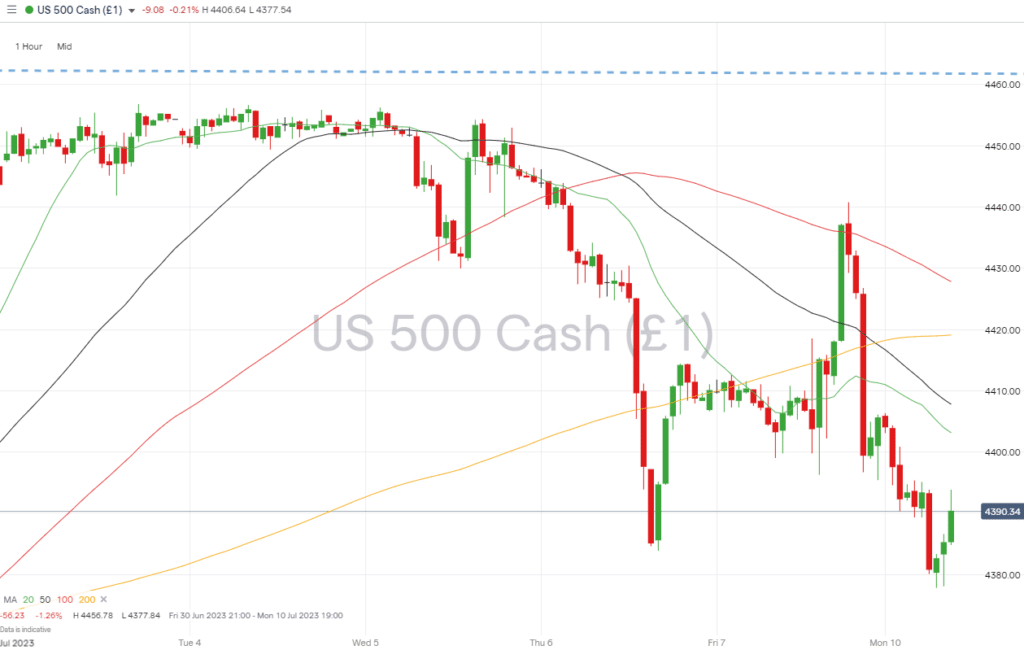
Source: IG
Short positions
- Entry Level 1: 4,458 – Current year-to-date price high. Strategies based on short positions backed up by the potential formation of a double-top price pattern.
- Price Target 1: 4,399 – Region of the 20 SMA on the Daily Price Chart and round number 4,400 price level.
- Price Target 2: 4,303 – In extension, region of the 50 SMA on Daily Price Chart, the psychologically important 4,300 price level, and the trendline of the bull-run in stocks, which started on 13th March.
- Stop Loss: > 4,500 – There are few resistance levels above trade entry point, but the 4,500-price bar should play on the mind of those in long positions.
Long positions
- Entry Level 1: 4,399 – Region of the 20 SMA on the Daily Price Chart. This metric has guided price since 26th March.
- Price Target 1: 4,458 – Price high printed on Friday 30th June.
- Stop Loss: < 4,303 – Convergence of three support levels: the 50 SMA on Daily Price Chart, the psychologically important 4,300 price level, and the trendline of the bull run in stocks, which started on 13th March.
Crypto – Bitcoin & Ethereum
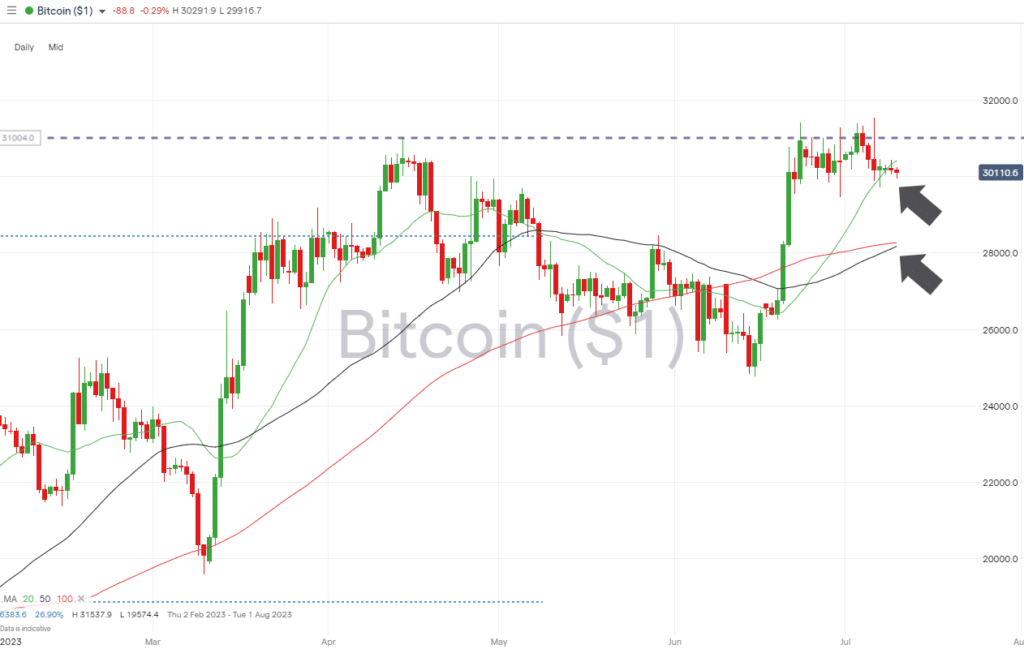
Crypto prices continue to consolidate just below key resistance levels. Bitcoin and Ethereum gave up some ground last week, with BTC down 2.01% and ETH down 3.59%. That has allowed key SMAs to catch up with price, and these could offer support and prime cryptos for their next bull run.
Bitcoin Price Chart – Daily Price Chart
Source: IG
Bitcoin Long positions
- Entry Level 1: 30,000 – Round number support level. Also, the region of the 20 SMA on the Daily Price Chart (30,416)
- Price Target 1: 31,537 – Current year-to-date price high printed on 6th July.
- Price Target 1: 36,180 – 50% Fib retracement level of the bull run between March 2019 and November 2021.
- Stop Losses: < 28,271 – Region of convergence of the 50 and 100 SMAs on the Daily Price Chart.
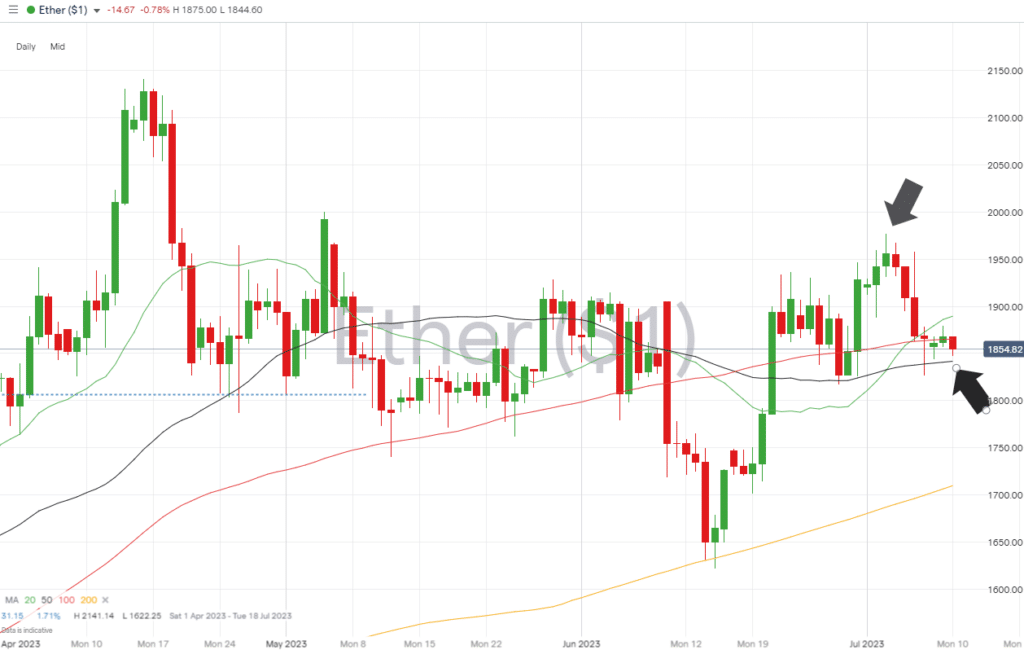
Ethereum
Ethereum Chart – Daily Price Chart
Source: IG
Ethereum Long positions
- Entry Level 1: 1,841 – Buying into weakness takes price to the level of the 50 SMA on the Daily Price Chart.
- Price Target 1: 2,000 – Psychologically important ‘round number’ support/resistance level last tested on 5th May.
- Price Target 2: 2,141 – In extension, the year-to-date price high printed on 16th April.
- Stop Losses: < 1,806 – Marks the 23.6% Fib retracement price of the 2022 price crash, which also sits just above the round number 1,800 price level.
Risk Statement: Trading financial products carries a high risk to your capital, especially trading leverage products such as CFDs. They may not be suitable for everyone. Please make sure that you fully understand the risks. You should consider whether you can afford to risk losing your money.

Forextraders' Broker of the Month
BlackBull Markets is a reliable and well-respected trading platform that provides its customers with high-quality access to a wide range of asset groups. The broker is headquartered in New Zealand which explains why it has flown under the radar for a few years but it is a great broker that is now building a global following. The BlackBull Markets site is intuitive and easy to use, making it an ideal choice for beginners.