
FOCUS ON: Earnings Season Kicks Off
- Increased appetite for risk assets triggered by low US inflation numbers
- Earnings season opens in the US with banks and Tesla reporting to investors
- UK CPI inflation report due Wednesday
Trading Ideas
We created this Weekly Tips section to share possible trade entry and exit points based on our technical analysis. We also have other methods to validate our trades which we can’t publicly share that help to increase their success. All our trades include entry and at least one target price. Stop losses are applied at the reader’s discretion. Our strategies typically trade with a wide stop loss, and risk is further mitigated by trading in small sizes.
Instrument | Price | Hourly | Daily |
GBP/USD | 1.3086 | Strong Buy | Strong Buy |
EUR/USD | 1.1238 | Strong Sell | Strong Buy |
USD/JPY | 138.59 | Strong Sell | Strong Sell |
S&P 500 | 4,504 | Strong Buy | Strong Buy |
NASDAQ 100 | 15,579 | Strong Buy | Strong Buy |
FTSE100 | 7,428 | Sell | Neutral |
Gold | 1,952 | Strong Sell | Strong Buy |
Crude Oil WTI | 74.50 | Strong Sell | Strong Buy |
Bitcoin | 30,248 | Strong Sell | Neutral |
Ethereum | 1,929 | Buy | Buy |
UTC: 09:26
US Dollar Basket Index (DXY)
Last week’s US inflation report showed that the consumer price index rose 0.2% in June and was up only 3% from a year ago. That is the slowest price growth seen since March 2021, and it triggered a rush into risk assets as analysts wondered whether inflation, in the US at least, has been beaten. The US dollar gave up ground as investors fled the security the currency offers during times of economic distress.
US Dollar Basket Chart – Daily Price Chart – Trendline break
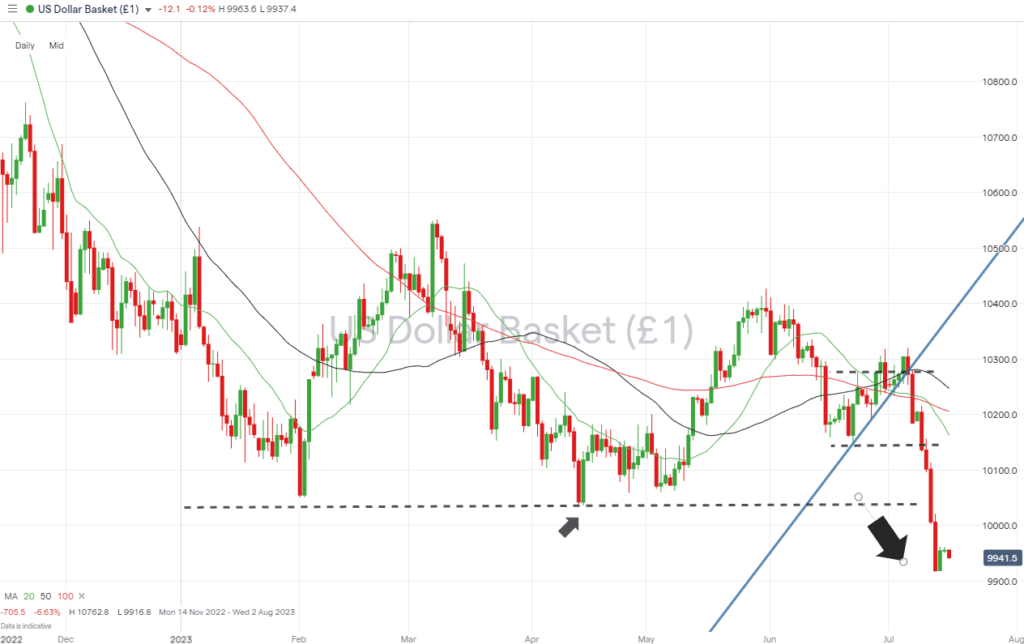
Source: IG
US Dollar Basket Chart – Hourly Price Chart
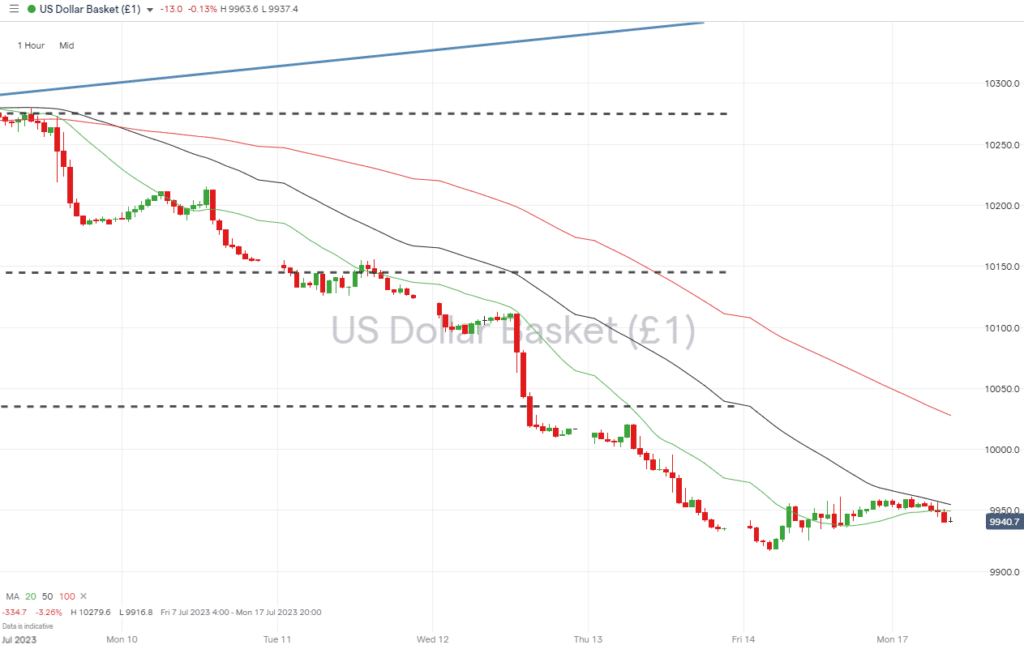
Source: IG
Short positions
- Entry Level 1: 99.54 – Region of the 50 SMA on the Hourly Price Chart. With strong downward momentum dominating the dollar market, many with a bearish view of the greenback’s prospects will choose short-term SMAs to identify trade entry points.
- Price Target 1: 98.02 – Region of the 50 SMA on the Monthly Price Chart.
- Price Target 2: 94.59 – In extension, price low recorded in January 2022 which forms a swing-low price pattern.
- Stop Loss: > 100.00 – Psychologically important parity price level.
Long positions
- Entry Level 1: 99.16 – New year-to-date price low printed on 13th July. With the RSI on the Daily Price Chart at 27.7, some will be looking to trade price rallies based on the market being oversold in that timeframe.
- Price Target 1: 100.00 – Parity price level.
- Price Target 2: 101.62 – Region of the 20 SMA on the Daily Price Chart and price low of 22nd June (101.47).
- Stop Loss: < 98.02 – Region of the 50 SMA on the Monthly Price Chart.
GBPUSD
The confirmed break of the 23.6% Fibonacci retracement level of the multi-year downward price move from November 2007 to September 2022 means that the GBPUSD bull run has room to continue. The RSI on the Daily Price Chart has traded above 70 since Tuesday 11th July, which could result in short-term price weakness.
Daily Price Chart – GBPUSD Chart – Daily Price Chart – Fib Level Resistance
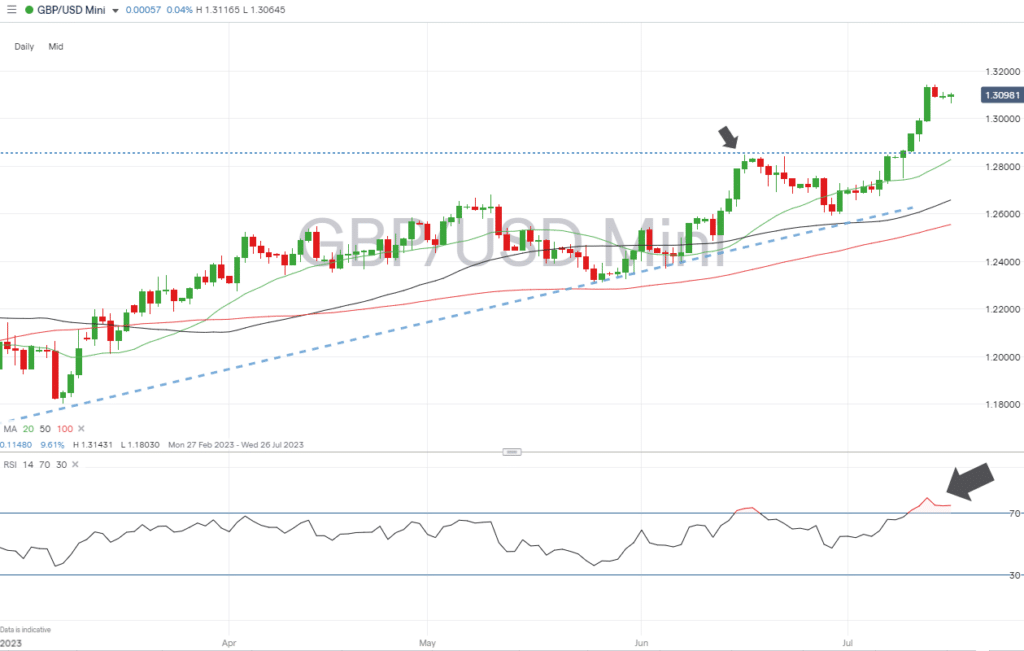
Source: IG
GBPUSD Chart – Hourly Price Chart
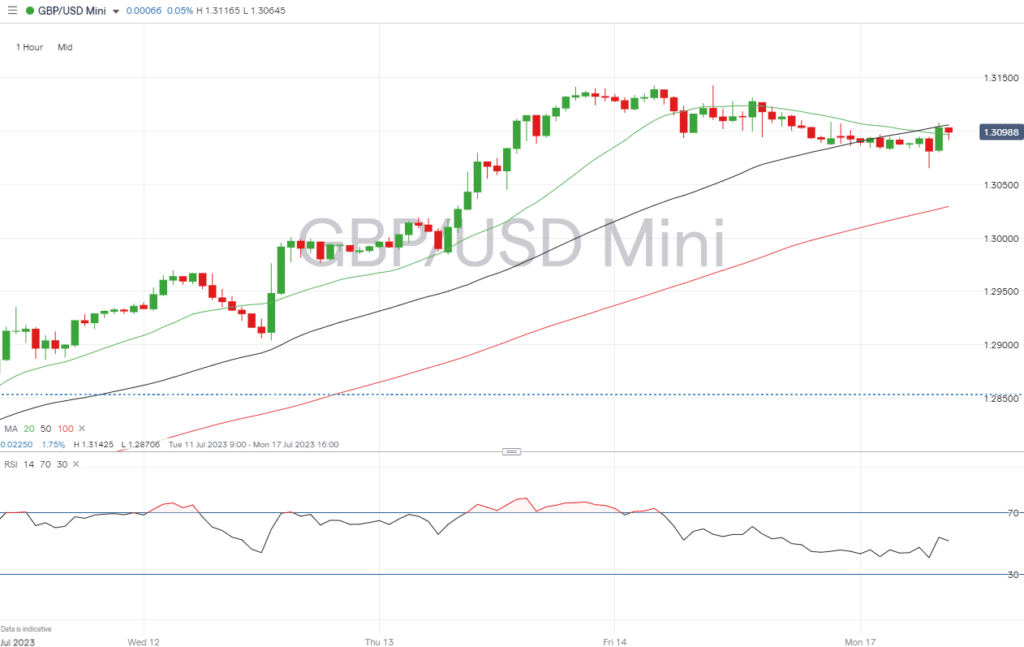
Source: IG
Short positions
- Entry Level 1: 1.31431 – New year-to-date price high printed on Thursday 13th July.
- Price Target 1: 1.30295 – Region of the 100 SMA on the Hourly Price Chart and psychologically important round number support of 1.3000.
- Price Target 2: 1.28283 – In extension, 20 SMA on the Daily Price Chart.
- Stop Loss: > 1.31431 – With few resistance levels above the trade entry point, a tight stop-loss will limit losses should the upward trend continue.
Long positions
- Entry Level 1: 1.30295 – Region of the 100 SMA on the Hourly Price Chart. Price bounced off this metric on 10th July before starting its extended upward move.
- Price Target 1: 1.31431 – New year-to-date price high.
- Stop Loss: < 1.28539 – The 23.6% Fib level offers acted as resistance throughout June and can now be expected to offer support.
EURUSD
Last week’s upward move by EURUSD broke through the double-top pattern forming through February and May, and the currency pair printed a new year-to-date high. That has brought two long-term metrics into play, the 50 and 100 SMAs on the Monthly Price Chart.
EURUSD Chart – Daily Price Chart
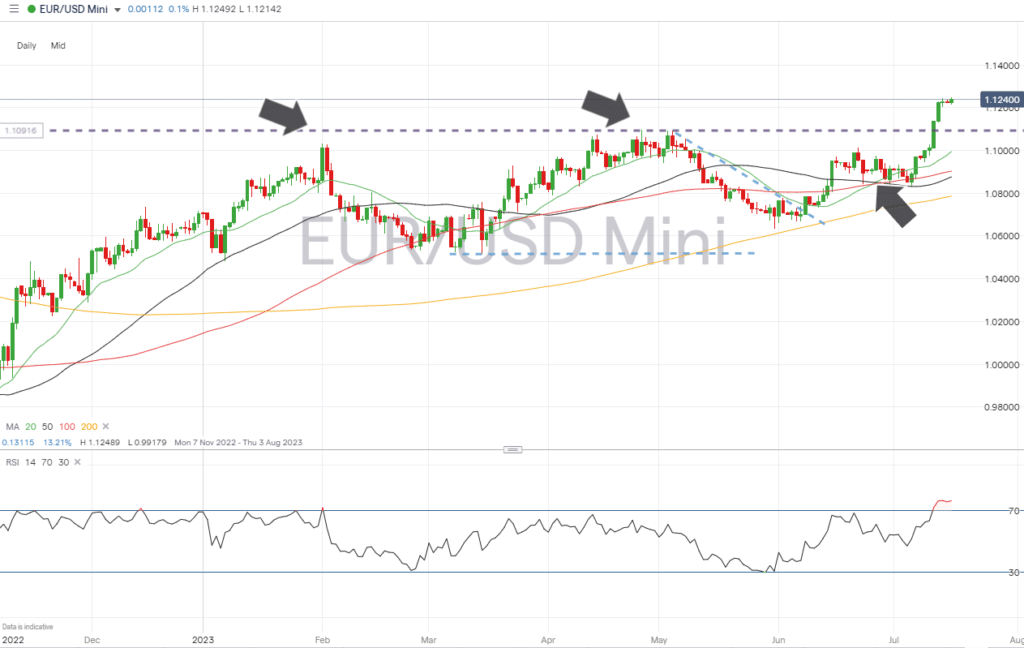
Source: IG
EURUSD Chart – Hourly Price Chart
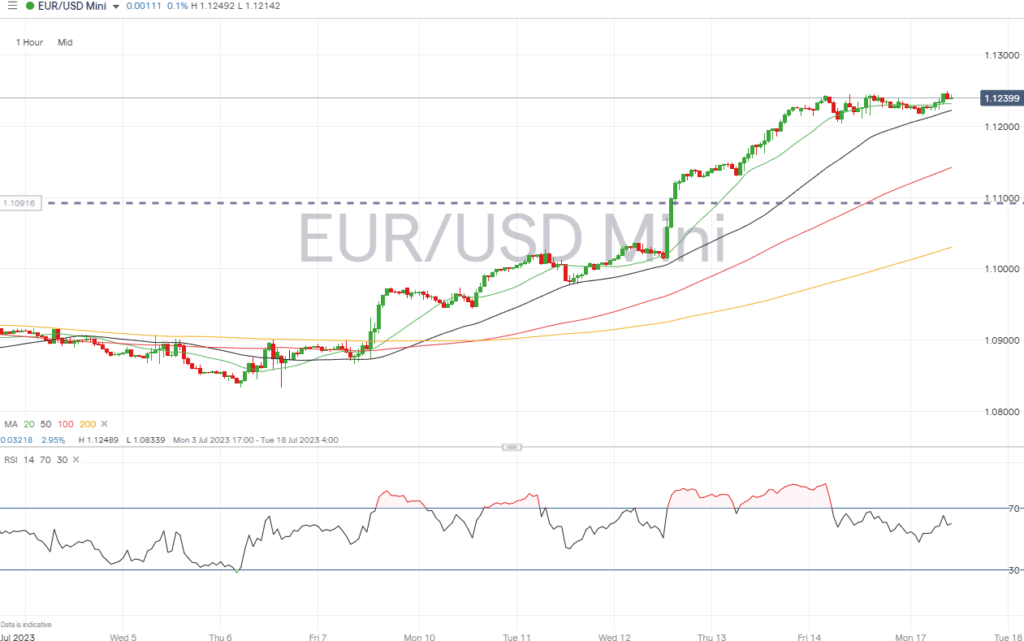
Source: IG
Short positions
- Entry Level 1: 1.12553 – Region of the 100 SMA on the Monthly Price Chart.
- Price Target 1: 1.100 – Psychologically important price level and region of the 20 SMA on the Daily Price Chart (1.09958).
- Price Target 2: 1.0900 – In extension, the region of the Daily Price Chart where the 50 and 100 SMAs are converging.
- Stop Loss: > 1.12553 – Tight stop loss due to there being few resistance levels above the trade entry price.
Long positions
- Entry Level 1: 1.10918 – Buying into short-term weakness, which takes price to the region of double-top price levels.
- Price Target 1: 1.12489 – New year-to-date price high printed on 17th July.
- Stop Loss: < 1.09958 – Region of 20 SMA on the Daily Price Chart and round-number support at the 1.1000 price level.
Indices
S&P 500
The stock-friendly inflation data released last week kickstarted a rally in major equity indices. With the US earnings season picking up momentum, reports released by big corporations can be expected to guide prices over the coming weeks.
S&P 500 Chart – Daily Price Chart
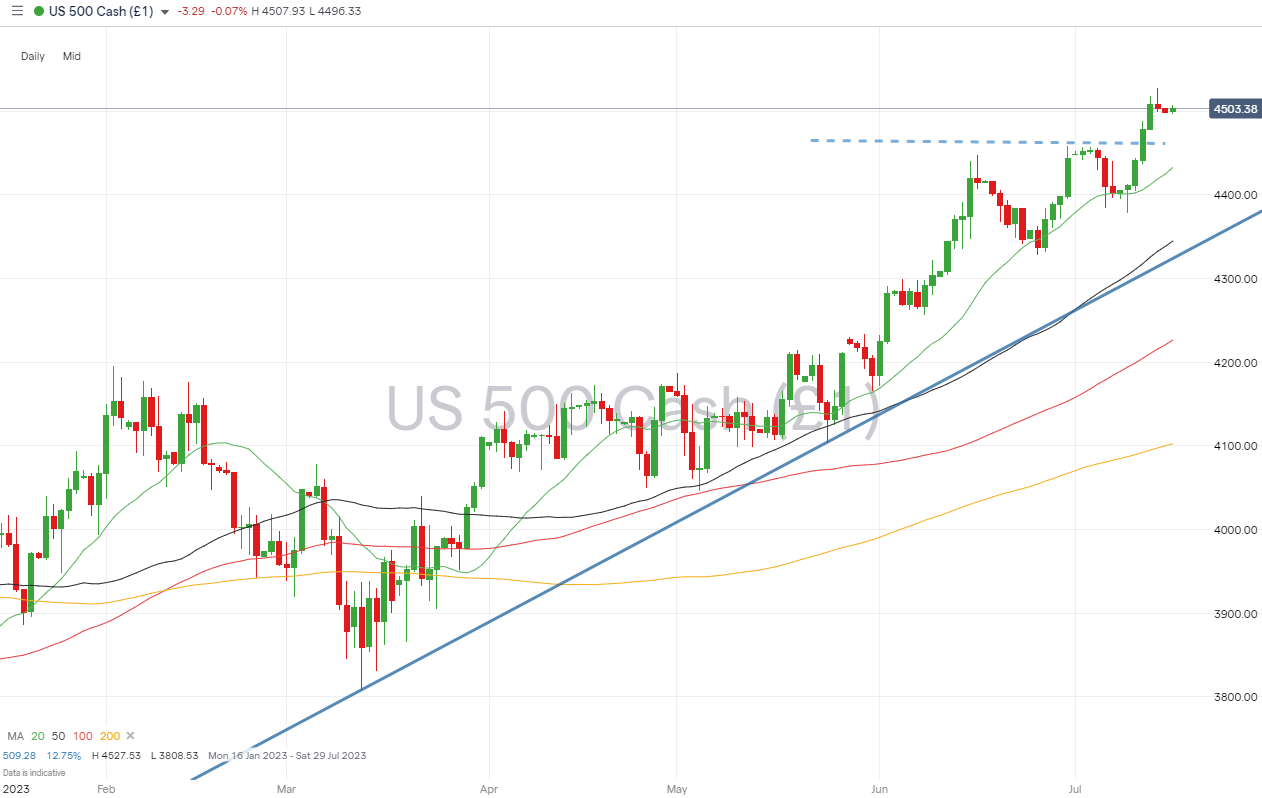
Source: IG
S&P 500 – Hourly Price Chart
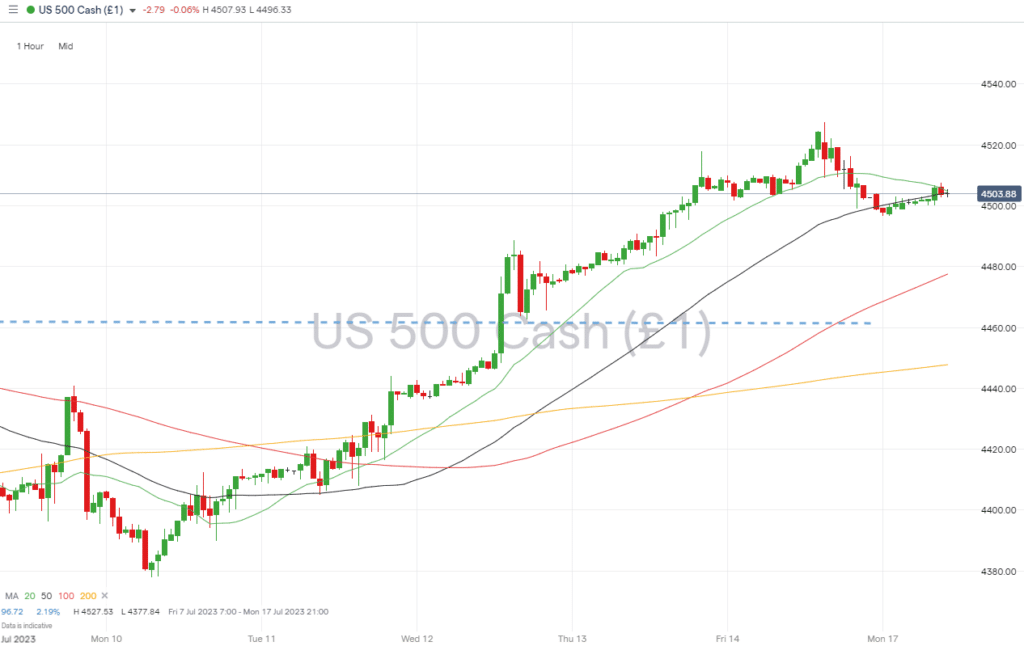
Source: IG
Short positions
- Entry Level 1: 4,527 – New year-to-date price high recorded on 14th July.
- Price Target 1: 4,432 – Region of the 20 SMA on the Daily Price Chart.
- Price Target 2: 4,344 – In extension, region of the 50 SMA on Daily Price Chart and the trendline of the bull run in stocks started on 13th March.
- Stop Loss: > 4,600 – There are few resistance levels above the trade entry point, but the round number price bar of 4,600 could play on the mind of those in long positions.
Long positions
- Entry Level 1: 4,344 – Buying into weakness which takes price to the region of the 20 SMA on the Daily Price Chart. This metric has guided price since 26th March.
- Price Target 1: 4,527 – New year-to-date price high recorded on 14th July.
- Stop Loss: < 4,344 – Convergence of two support levels: the 50 SMA on Daily Price Chart and the trendline of the bull run in stocks, which started in March.
Crypto – Bitcoin & Ethereum
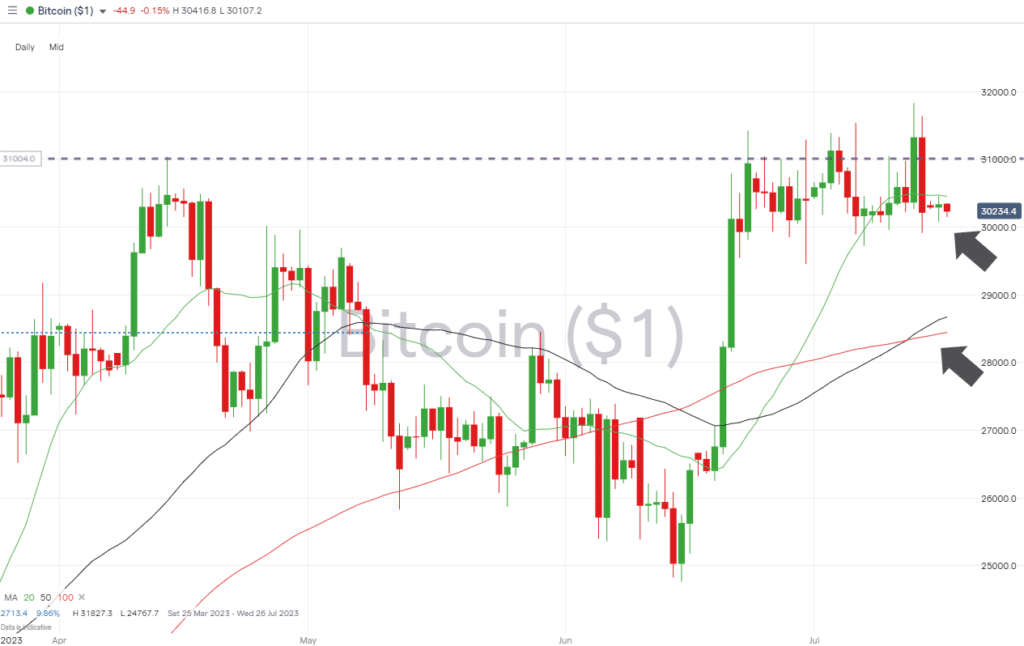
While more mainstream assets reacted to the US inflation report, Bitcoin and Ethereum posted relatively modest week-on-week price gains. Bitcoin gained in value by 0.58% and Ethereum by 4.05%.
Bitcoin Price Chart – Daily Price Chart
Source: IG
Bitcoin Long positions
- Entry Level 1: 30,453 – The strong price performance recorded on 13th July saw BTC post a new year-to-date high (31,827). A break of the 20 SMA on the Daily Price Chart would suggest that price resistance level is to be tested again.
- Price Target 1: 31,827 – Current year-to-date price high printed on 13th July.
- Price Target 1: 36,180 – 50% Fib retracement level of the bull run between March 2019 and November 2021.
- Stop Losses: < 28,673 – Region of convergence of the 50 and 100 SMAs on the Daily Price Chart.
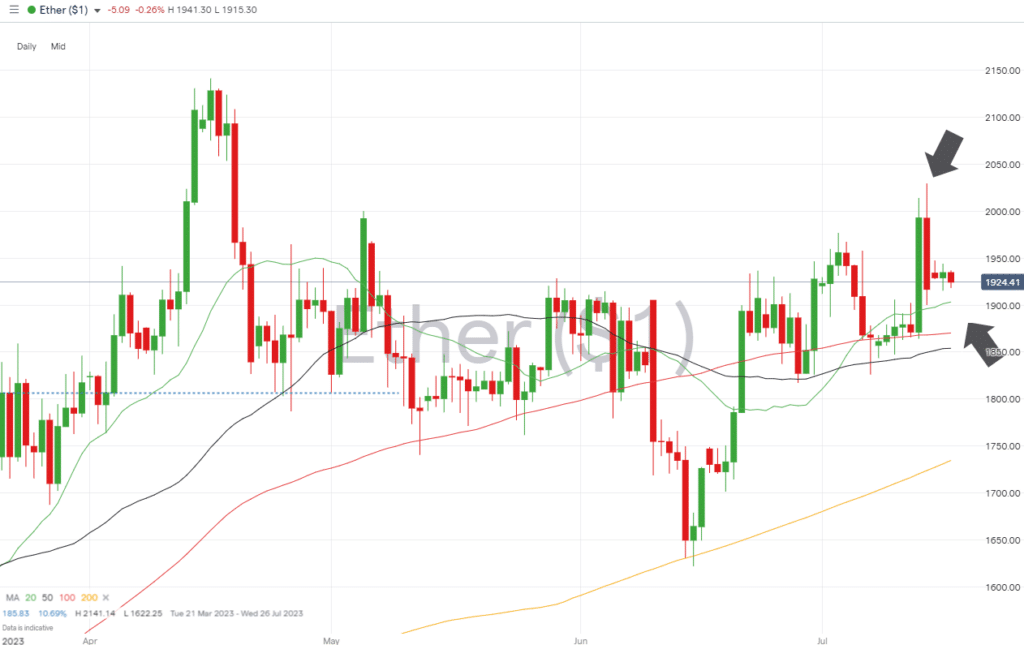
Ethereum
Ethereum Chart – Daily Price Chart
Source: IG
Ethereum Long positions
- Entry Level 1: 1,903 – Buying into weakness which takes price to the level of the 20 SMA on the Daily Price Chart.
- Price Target 1: 2,000 – Psychologically important ‘round number’ support/resistance level, tested again on the 13th and 14th July.
- Price Target 2: 2,141 – In extension, the year-to-date price high printed on 16th April.
- Stop Losses: 1,806 – Marks the 23.6% Fib retracement price of the 2022 price crash, which also sits just above the round number 1,800 price level.
Risk Statement: Trading financial products carries a high risk to your capital, especially trading leverage products such as CFDs. They may not be suitable for everyone. Please make sure that you fully understand the risks. You should consider whether you can afford to risk losing your money.

Forextraders' Broker of the Month
BlackBull Markets is a reliable and well-respected trading platform that provides its customers with high-quality access to a wide range of asset groups. The broker is headquartered in New Zealand which explains why it has flown under the radar for a few years but it is a great broker that is now building a global following. The BlackBull Markets site is intuitive and easy to use, making it an ideal choice for beginners.