
FOCUS ON: Jobs Data Set to Cap Off a Busy Week
- US Non-Farm Payrolls jobs report due on Friday
- Tech giants update investors on recent earnings
- Euro GDP data is also likely to trigger increases in price volatility
Trading Ideas
We created this Weekly Tips section to share possible trade entry and exit points based on our technical analysis. We also have other methods to validate our trades which we can’t publicly share that help to increase their success. All our trades include entry and at least one target price. Stop losses are applied at the reader’s discretion. Our strategies typically trade with a wide stop loss, and risk is further mitigated by trading in small sizes.
Instrument | Price | Hourly | Daily |
GBP/USD | 1.2856 | Neutral | Neutral |
EUR/USD | 1.1009 | Strong Sell | Sell |
USD/JPY | 142.03 | Strong Buy | Strong Buy |
S&P 500 | 4,576 | Strong Buy | Strong Buy |
NASDAQ 100 | 15,724 | Strong Buy | Strong Buy |
FTSE100 | 7,671 | Sell | Strong Buy |
Gold | 1,953 | Strong Buy | Strong Buy |
Crude Oil WTI | 80.25 | Strong Buy | Strong Buy |
Bitcoin | 29,360 | Sell | Sell |
Ethereum | 1,863 | Sell | Neutral |
UTC: 09:02
US Dollar Basket Index (DXY)
Last week’s updates on interest rates by the US Federal Reserve and ECB resulted in short-term spikes in price volatility, with the DXY ending the week up by 0.61%. The long-term downtrend, which started in September 2022, is still in place, but movements in price since February suggest the index could be bottoming out between the price range of 1.00 and 1.04.
US Dollar Basket Chart – Daily Price Chart – Bottoming Out?
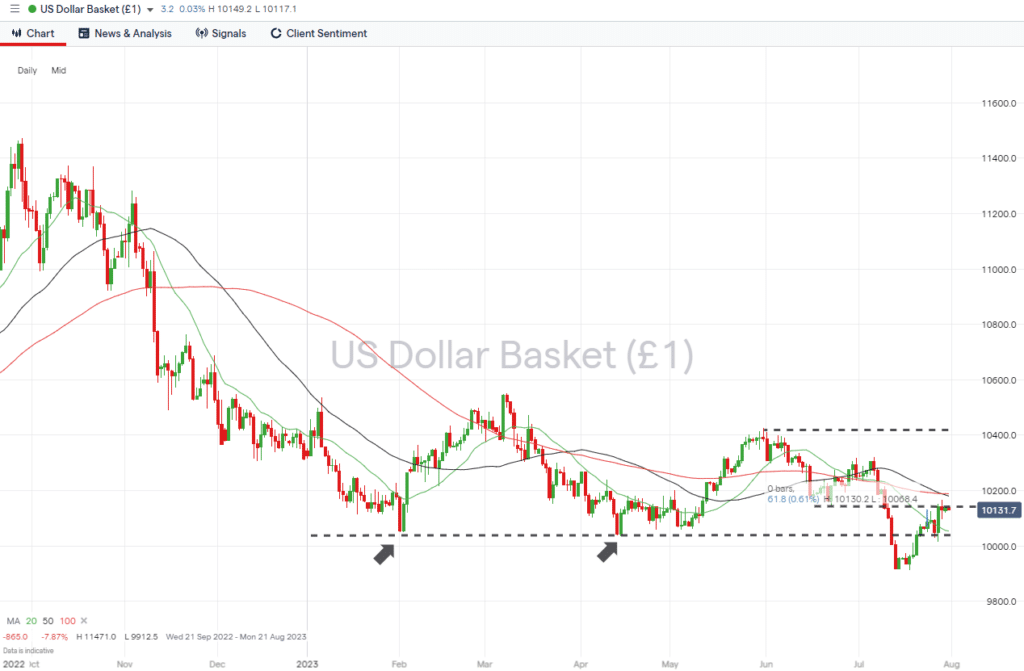
Source: IG
US Dollar Basket Chart – Hourly Price Chart
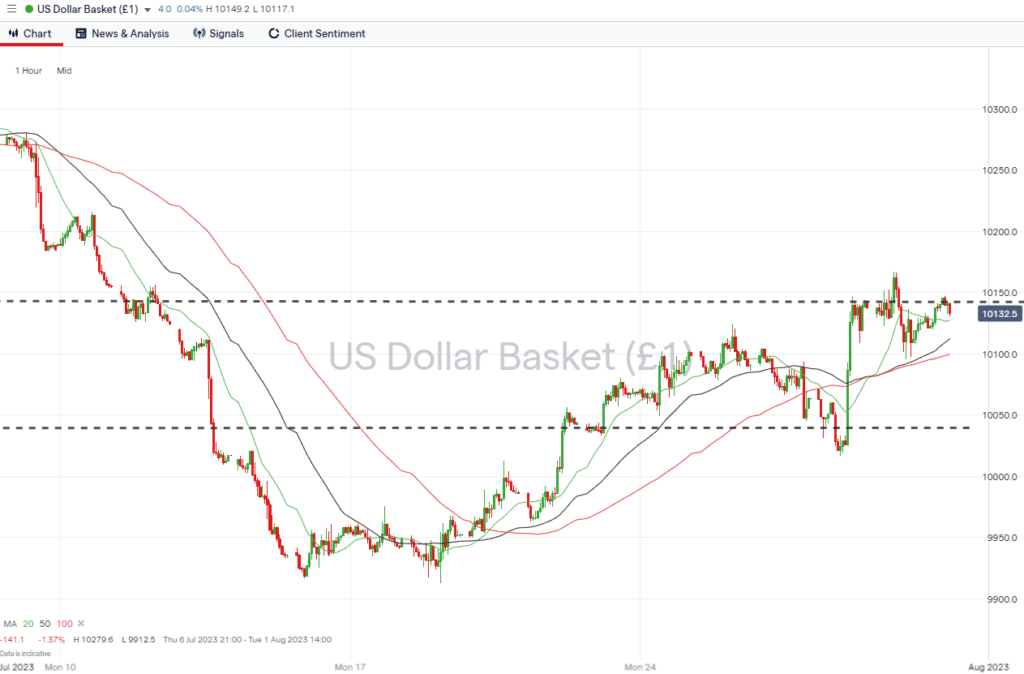
Source: IG
Short positions
- Entry Level 1: 101.47 – Price low of 22nd June. This swing low marker point has acted as resistance to the short-term rally, which started on 27th July.
- Price Target 1: 100.54 – Region of the 20 SMA on the Daily Price Chart and swing-low price point of 14th April.
- Price Target 2: 100.00 – Psychologically important parity price level.
- Price Target 3: 94.59 – In extension, price low recorded in January 2022, which forms a swing-low price pattern.
- Stop Loss: > 101.80 – Convergence of the 50 and 100 SMAs on the Daily Price Chart.
Long positions
- Entry Level 1: 101.67 – A break of Friday’s intraday price high would confirm continued upward momentum.
- Price Target 1: 101.80 – Point at which there is a convergence of the 50 and 100 SMAs on the Daily Price Chart.
- Price Target 2: 104.26 – In extension, multi-month price high printed on 31st May.
- Stop Loss: < 100.00 – Psychologically important parity price level.
GBPUSD
The price of GBPUSD continues to be guided by two well-established technical indicators. The first is the 23.6% Fibonacci retracement level of the multi-year downward price move from November 2007 to September 2022; the second is the supporting trendline of the price move that started in September 2022.
The RSI on the Daily Price Chart now sits at 50.1, leaving room for price to make significant moves in either direction before being considered overbought or oversold. That leaves lots of scope for trading opportunities this week, thanks to the Bank of England updating the markets on its interest rate policy on Thursday.
Daily Price Chart – GBPUSD Chart – Daily Price Chart – Fib Level Resistance/Support
Source: IG
GBPUSD Chart – Hourly Price Chart
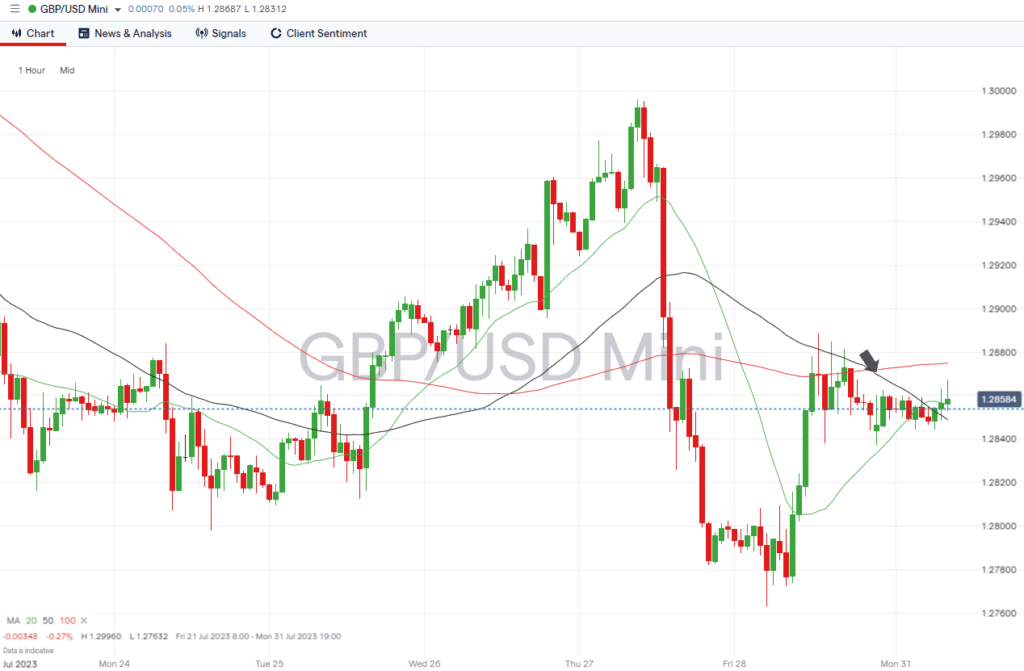
Source: IG
Short positions
- Entry Level 1: 1.28539 – The 23.6% Fib level is currently acting as support for the price of GBPUSD. A break below this key metric leaves room for further price falls.
- Price Target 1: 1.27715 – Region of the 50 SMA on the Daily Price Chart that sits just above the supporting trendline of the upward price move which started in September 2022.
- Price Target 2: 1.26196 – If price breaks through the supporting trendline, the next major support level is the 100 SMA on the Daily Price Chart.
- Stop Loss: > 1.29291 – Region of the 20 SMA on the Daily Price Chart.
Long positions
- Entry Level 1: 1.29293 – A break through the 20 SMA on the Daily Price Chart would confirm the upward trend still has momentum.
- Price Target 1: 1.300 – Psychologically important ‘round number’ price level.
- Price Target 2: 1.31431 – Year-to-date price high printed on 13th July.
- Stop Loss: < 1.28539 – The 23.6% Fib level offers can be expected to offer considerable support to price.
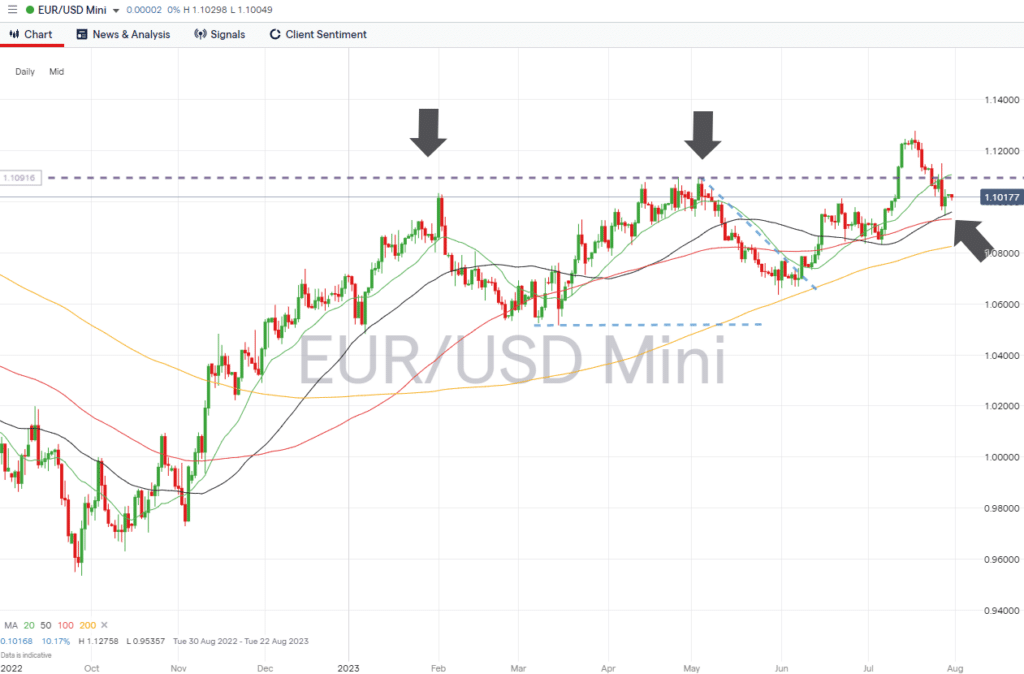
EURUSD
The central banks of the US and Eurozone both raised interest rates by 25 basis points last week. The consensus among investors was that the move made holding the US dollar more attractive, and after some whip-sawing price action, EURUSD finished the week down 0.67%. That has brought price back below the potential double-top price pattern that has been forming since February.
EURUSD Chart – Daily Price Chart
Source: IG
EURUSD Chart – Hourly Price Chart
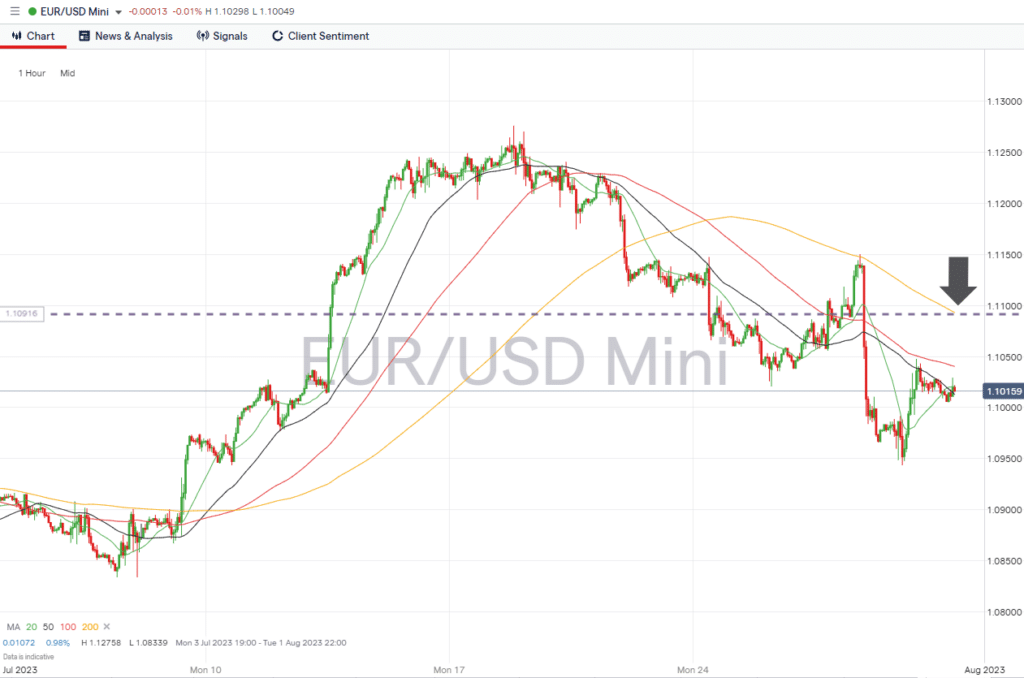
Source: IG
Short positions
- Entry Level 1: 1.10918 – Price high of 3rd May, which along with the price highs of February, forms part of a potential double-top price pattern. Also, the region of the 200 SMA on the Hourly Price Chart.
- Price Target 1: 1.09595 – Region of the 50 SMA on the Daily Price Chart and intraday price low (1.09437) recorded on 28th July.
- Price Target 2: 1.08246 – In extension, region of the 200 SMA on the Daily Price Chart.
- Stop Loss: > 1.11054 – The 20 SMA on the Daily Price Chart sits just above the round number resistance provided by the 1.10 price bar.
Long positions
- Entry Level 1: 1.09595 – Buying into short-term weakness, which takes price to the region of the 50 SMA on the Daily Price Chart. GBPUSD has closed above this metric since 15th June.
- Price Target 1: 1.10918 – Price high of 3rd May. Double-top price point.
- Price Target 2: 1.12758 – New year-to-date price high printed on 18th July.
- Stop Loss: < 1.09321 – Tight stop loss offered by the 100 SMA on the Daily Price Chart.
Indices
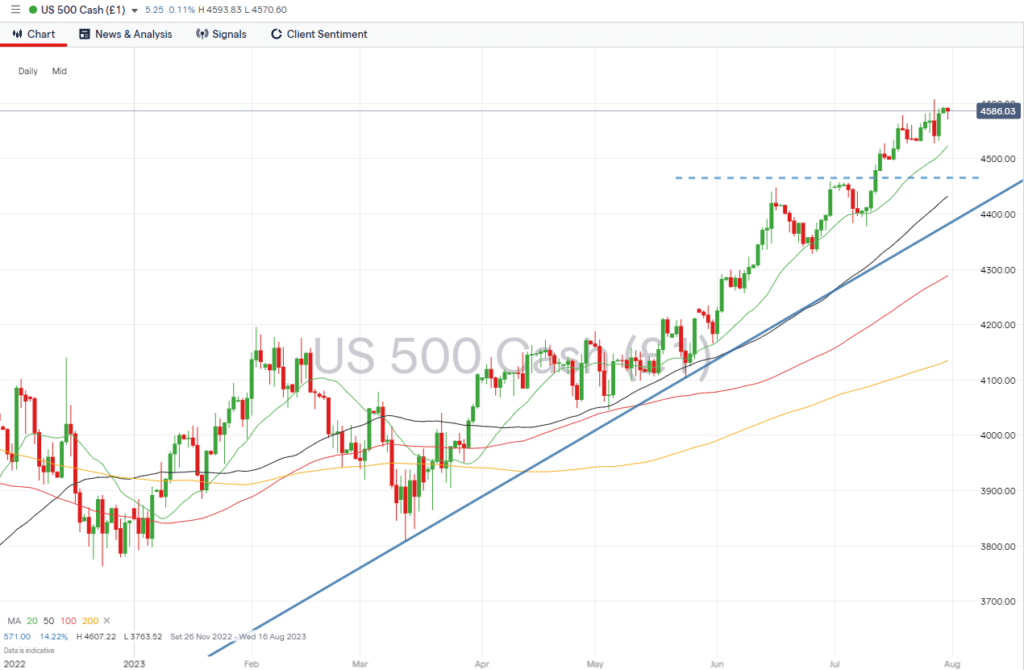
S&P 500
The Fed’s interest rate announcement and continued releases of corporate earnings reports triggered short-term price volatility in the S&P 500 index during the middle of last week. The bullish sentiment in the markets resulted in the index posting a 1% gain on the week, and 15 of the last 20 weeks have generated positive returns.
S&P 500 Chart – Daily Price Chart
Source: IG
S&P 500 – Hourly Price Chart
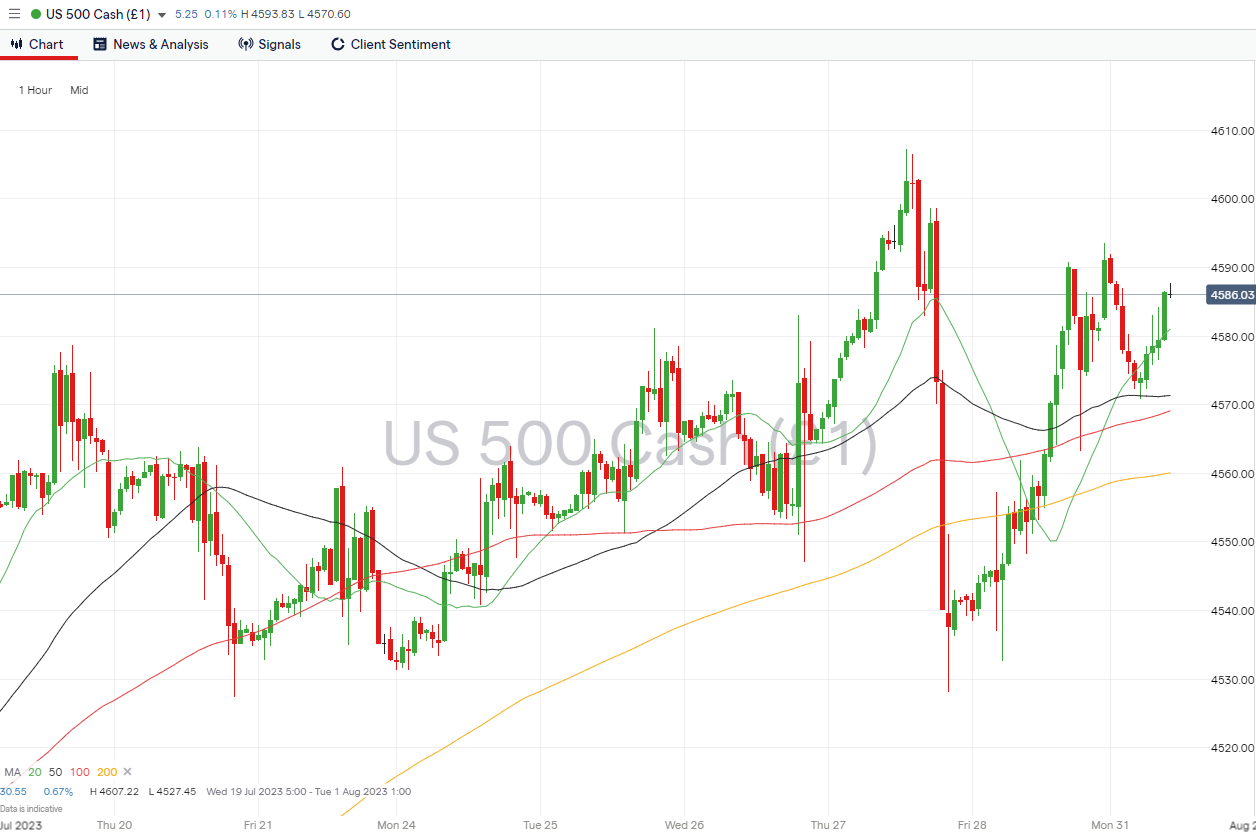
Source: IG
Short positions
- Entry Level 1: 4,607 – New year-to-date price high recorded on 27th July.
- Price Target 1: 4,523 – Region of the 20 SMA on the Daily Price Chart.
- Price Target 2: 4,431 – In extension, region of the 50 SMA on Daily Price Chart and the price highs of 16th and 30th June.
- Stop Loss: > 4,400 – Supporting trendline of the bull run that started in mid-March and ‘round number’ price level.
Long positions
- Entry Level 1: 4,523 – Buying into short-term price weakness, which takes price to the region of the 20 SMA on the Daily Price Chart. It’s now almost one month since price closed below this key metric.
- Price Target 1: 4,607 –Year-to-date price high recorded on 27th July.
- Stop Loss: < 4,431 – Region of the 50 SMA on Daily Price Chart.
Crypto – Bitcoin & Ethereum
Price action in crypto assets continues to form consolidation patterns, and Bitcoin and Ethereum posted modest losses last week. BTC lost 1.40% in value and ETH 0.43%. The sideways trading trend has allowed long-term moving averages to catch up with price and to be in a better position to support any future upward price movements.
Bitcoin Price Chart – Daily Price Chart
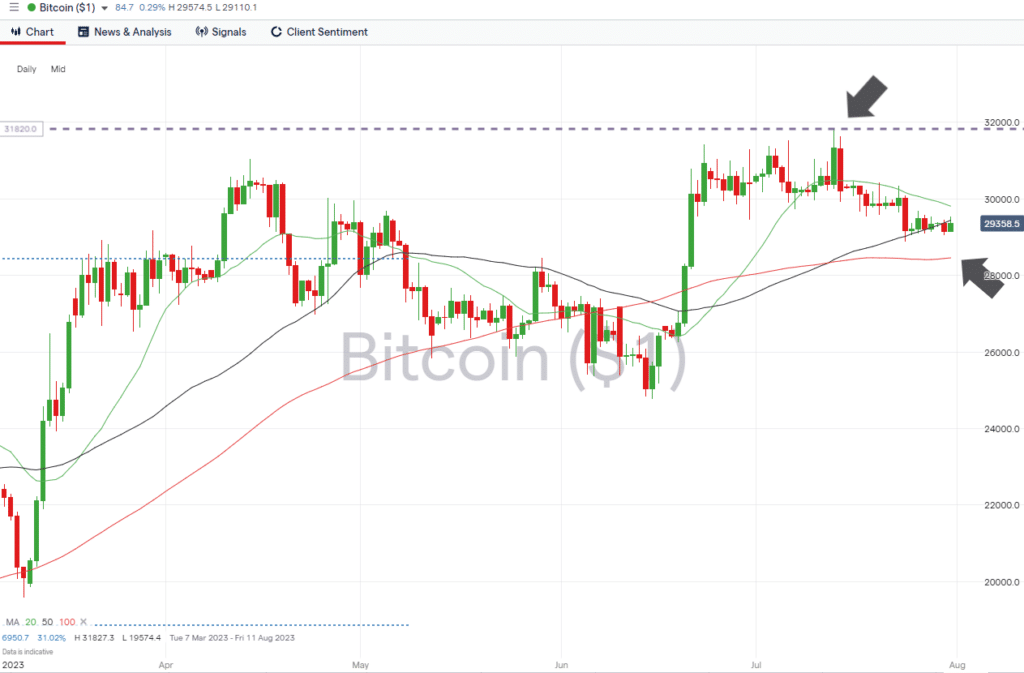
Source: IG
Bitcoin Long positions
- Entry Level 1: 29,807 – A break of the 20 SMA on the Daily Price Chart would suggest renewed upward momentum, and that metric now sits below the psychologically important 30k price level.
- Price Target 1: 31,827 – Current year-to-date price high printed on 13th July.
- Price Target 1: 36,180 – 50% Fib retracement level of the price rise, which took place between March 2019 and November 2021.
- Stop Losses: < 28,458 – Region of the 100 SMA on the Daily Price Chart.
Ethereum
Ethereum Chart – Daily Price Chart
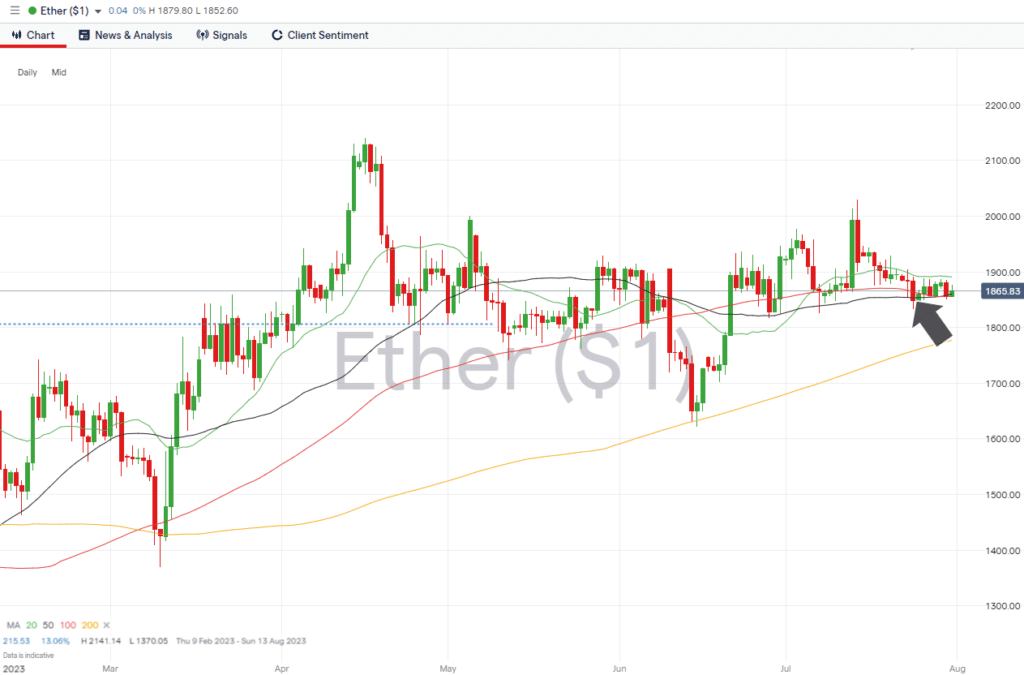
Source: IG
Ethereum Long positions
- Entry Level 1: 1,855 – Buying into weakness takes price to the level of the 100 SMA on the Daily Price Chart. The 50 SMA, currently trading at 1,860, offers an alternative entry point.
- Price Target 1: 2,000 – Psychologically important ‘round number’ support/resistance level that acted as resistance on the 13th and 14th July.
- Price Target 2: 2,141 – In extension, year-to-date price high printed on 16th April.
- Stop Losses: < 1,806 – This price level marks the 23.6% Fib retracement price of the 2022 price crash. It also sits just above the round number 1,800 price support level.
Risk Statement: Trading financial products carries a high risk to your capital, especially trading leverage products such as CFDs. They may not be suitable for everyone. Please make sure that you fully understand the risks. You should consider whether you can afford to risk losing your money.

Forextraders' Broker of the Month
BlackBull Markets is a reliable and well-respected trading platform that provides its customers with high-quality access to a wide range of asset groups. The broker is headquartered in New Zealand which explains why it has flown under the radar for a few years but it is a great broker that is now building a global following. The BlackBull Markets site is intuitive and easy to use, making it an ideal choice for beginners.