
FOCUS ON: Technical Patterns Realign After Busy News Weeks
- News flow quietens down this week.
- Earnings season also begins to slow down.
- Technical analysis indicators set to play a large role in determining price movements.
Trading Ideas
We created this Weekly Tips section to share possible trade entry and exit points based on our technical analysis. We also have other methods to validate our trades which we can’t publicly share that help to increase their success. All our trades include entry and at least one target price. Stop losses are applied at the reader’s discretion. Our strategies typically trade with a wide stop loss, and risk is further mitigated by trading in small size.
Instrument | Price | Hourly | Daily |
GBP/USD | 1.2723 | Strong Sell | Strong Sell |
EUR/USD | 1.0984 | Strong Sell | Sell |
USD/JPY | 142.18 | Strong Buy | Strong Buy |
S&P 500 | 4,495 | Strong Sell | Sell |
NASDAQ 100 | 15,352 | Strong Sell | Sell |
FTSE100 | 7,546 | Strong Buy | Sell |
Gold | 1,937 | Strong Sell | Sell |
Crude Oil WTI | 82.37 | Strong Buy | Strong Buy |
Bitcoin | 29,049 | Sell | Sell |
Ethereum | 1,831 | Strong Sell | Strong Sell |
UTC: 08:08
US Dollar Basket Index (DXY)
After two weeks packed full of data announcements, the markets now face a period of relative quiet. There are sufficient data releases to act as a catalyst for price moves, but for the technical analysis trade indicators, support and resistance levels can be expected to play a greater role in guiding price.
US Dollar Basket Chart – Daily Price Chart
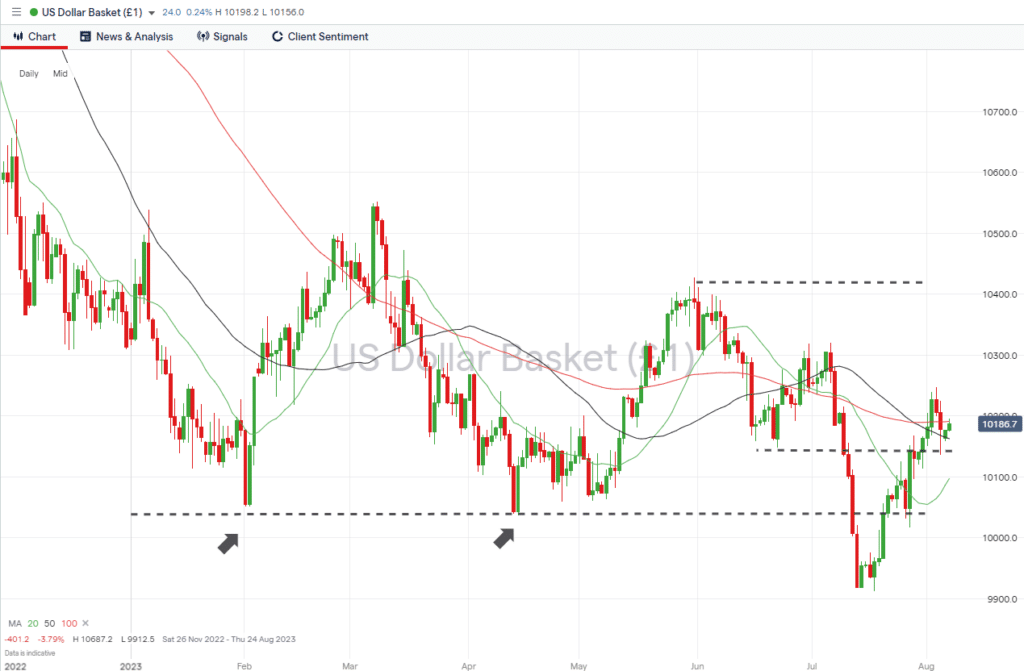
Source: IG
US Dollar Basket Chart – Hourly Price Chart
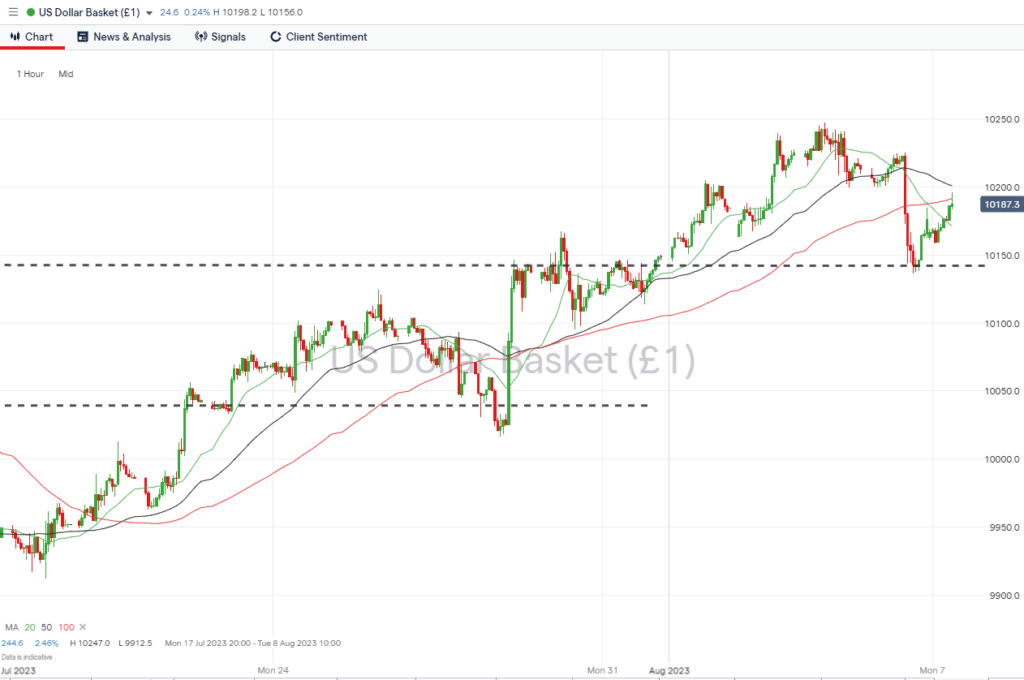
Source: IG
Short positions
- Entry Level 1: 101.36 – A new phase of downwards momentum and a break out of last week’s sideways trading channel would be signalled by price moving below Friday’s intraday low price of 101.36.
- Price Target 1: 100.96 – Region of the 20 SMA on the Daily Price Chart.
- Price Target 2: 100.00 – Psychologically important parity price level.
- Price Target 3: 94.59 – In extension, price low recorded in January 2022, which forms a swing-low price pattern.
- Stop Loss: > 102.37 – Maximum extent of short-term price spike printed on 3rd August.
Long positions
- Entry Level 1: 101.62 – Region of the 50 SMA on the Daily Price Chart.
- Price Target 1: 101.90 – Region of the 100 SMA on the Daily Price Chart.
- Price Target 2: 104.26 – In extension, multi-month price high printed on 31st May.
- Stop Loss: < 100.00 – Psychologically important parity price level.
GBPUSD
The price of GBPUSD has failed to establish a confirmed break through the 23.6% Fibonacci retracement level of the multi-year downwards price move from November 2007 to September 2022. Now, it has posted another bearish signal by falling below the supporting trendline of the price move that started in September 2022.
With the RSI on the Daily Price Chart now at 42.2, there is still room for further downwards price movement before the market is considered oversold.
Daily Price Chart – GBPUSD Chart – Daily Price Chart – Fib Level Resistance/Support
Source: IG
GBPUSD Chart – Hourly Price Chart
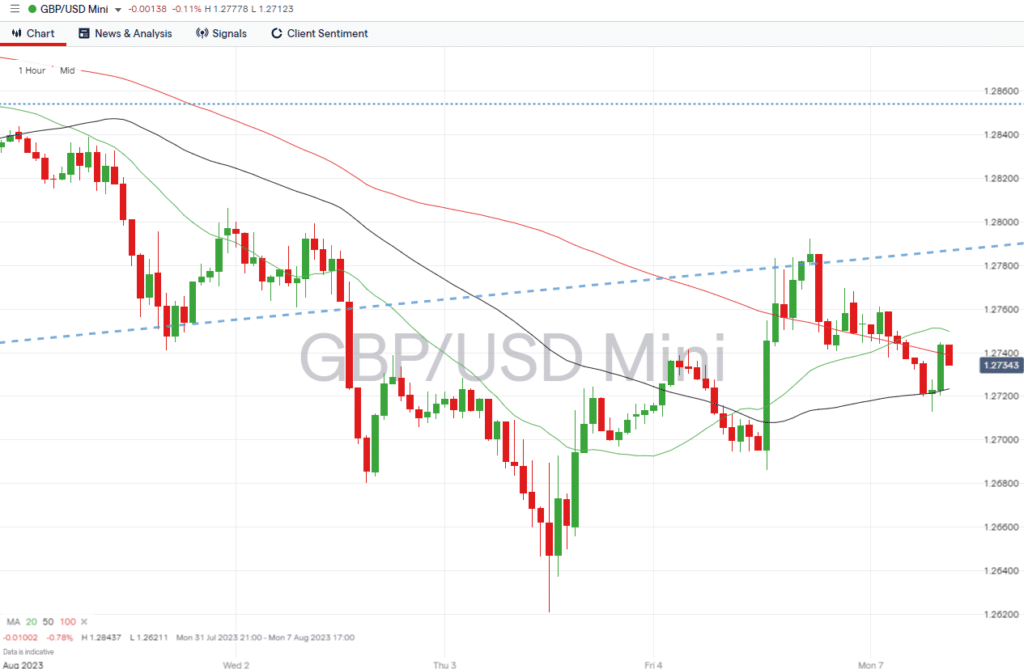
Source: IG
Short positions
- Entry Level 1: 1.28539 – The 23.6% Fib level is some way above current price levels but has been such an effective resistance level that many traders will be taking a patient approach before entering into short positions.
- Price Target 1: 1.28028 – Region of the 50 SMA on the Daily Price Chart and the supporting trendline of the upwards price move that started in September 2022.
- Price Target 2: 1.26381 – Should price break through the supporting trendline, the next major support level on the Daily Price Chart is the 100 SMA.
- Stop Loss: > 1.2958 – A tight stop loss set by the 20 SMA on the Daily Price Chart.
Long positions
- Entry Level 1: 1.26381 – Buying into weakness, which takes price to the region of the 100 SMA on the Daily Price Chart.
- Price Target 1: 1.28587 – A break through the 20 SMA on the Daily Price Chart would confirm that the upwards trend still has momentum.
- Price Target 2: 1.300 – Psychologically important ‘round number’ price level.
- Price Target 3: 1.31431 – Year-to-date price high printed on 13th July.
- Stop Loss: < 1.26211 – August month-to-date price low.
EURUSD
The sideways trading pattern that EURUSD formed last week leaves it trading below the price level of the potential double-top price pattern that has been forming since February. The RSI on the Daily Price Chart is printing in the region of 45.0, leaving room for upwards or downwards price trends to form. However, with little eurozone news due this week, a period of consolidation may be the more likely outcome.
EURUSD Chart – Daily Price Chart
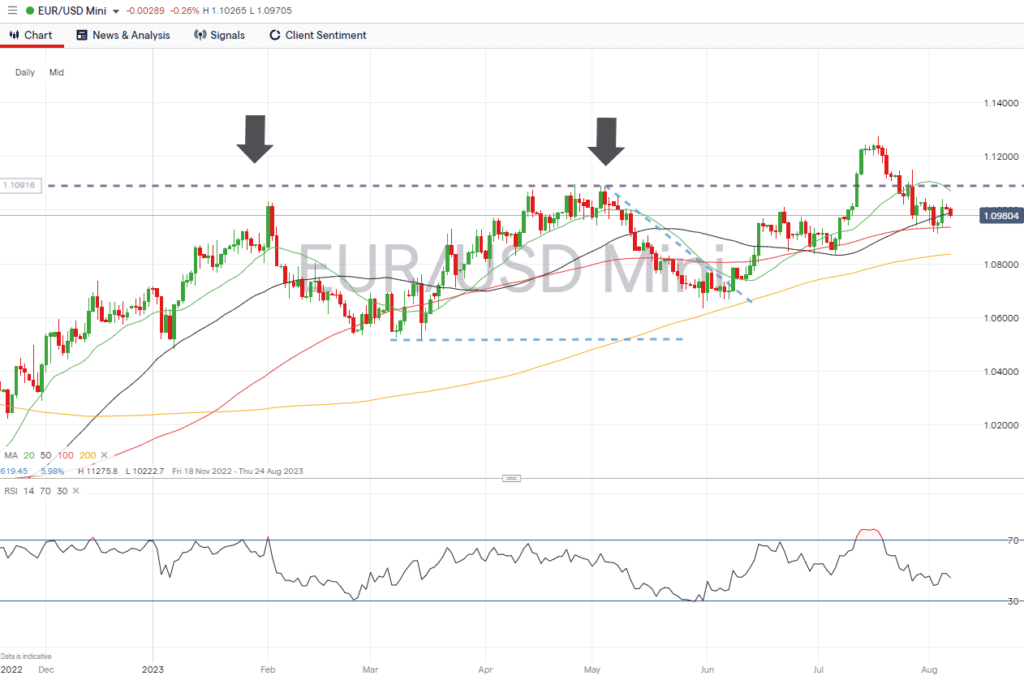
Source: IG
EURUSD Chart – Hourly Price Chart
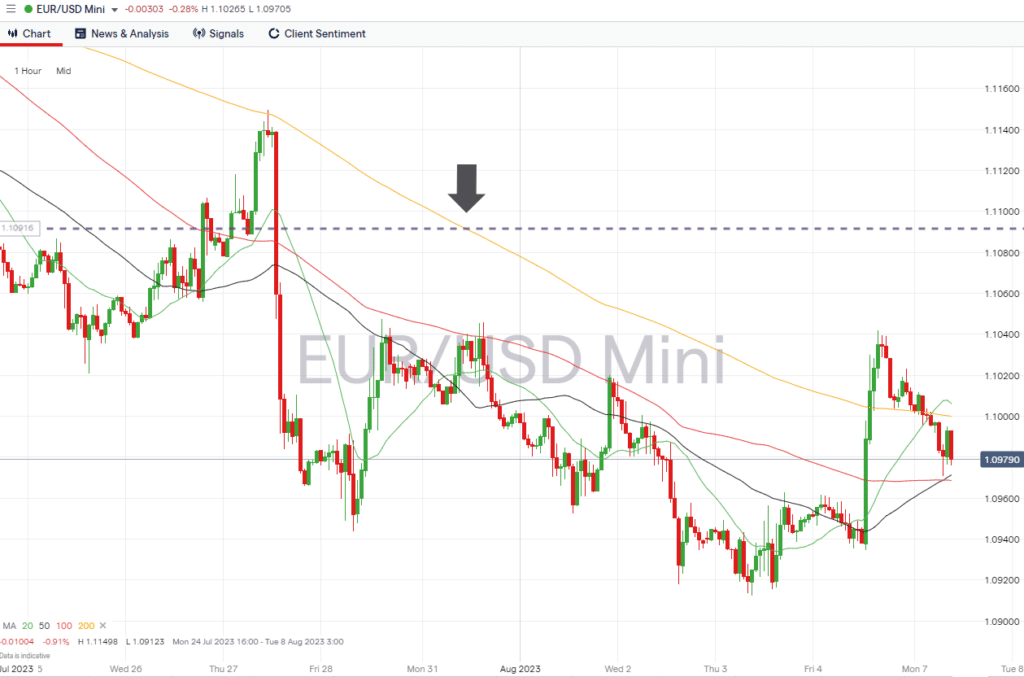
Source: IG
Short positions
- Entry Level 1: 1.10918 – Price high of 3rd May, which along with the price highs of February forms part of a potential double-top price pattern.
- Price Target 1: 1.09999 – In extension, region of the 200 SMA on the Hourly Price Chart and 1.10 ‘round number’ price level.
- Price Target 2: 1.09902 – Region of the 50 SMA on the Daily Price Chart and intraday price low (1.09437) recorded on 28th July.
- Stop Loss: > 1.12758 – Year-to-date price high recorded on 18th July.
Long positions
- Entry Level 1: 1.09358 – Buying into short-term weakness, which takes price to the region of the 100 SMA on the Daily Price Chart. GBPUSD has closed above this key metric since 6th July.
- Price Target 1: 1.10918 – Price high of 3rd May. Double-top price point.
- Price Target 2: 1.12758 – New year-to-date price high printed on 18th July.
- Stop Loss: < 1.09123 – Tight stop loss offered by the swing-low price recorded on Thursday 3rd August.
Indices
S&P 500
Earnings season is drawing to a close, and while stock prices remain buoyant, there are now relatively few diarised upcoming news events that might be significant enough to trigger another upwards leg in stock prices. This could leave room for a period of price consolidation, which would favour strategies based on range-bound trading conditions.
S&P 500 Chart – Daily Price Chart
Source: IG
S&P 500 – Hourly Price Chart
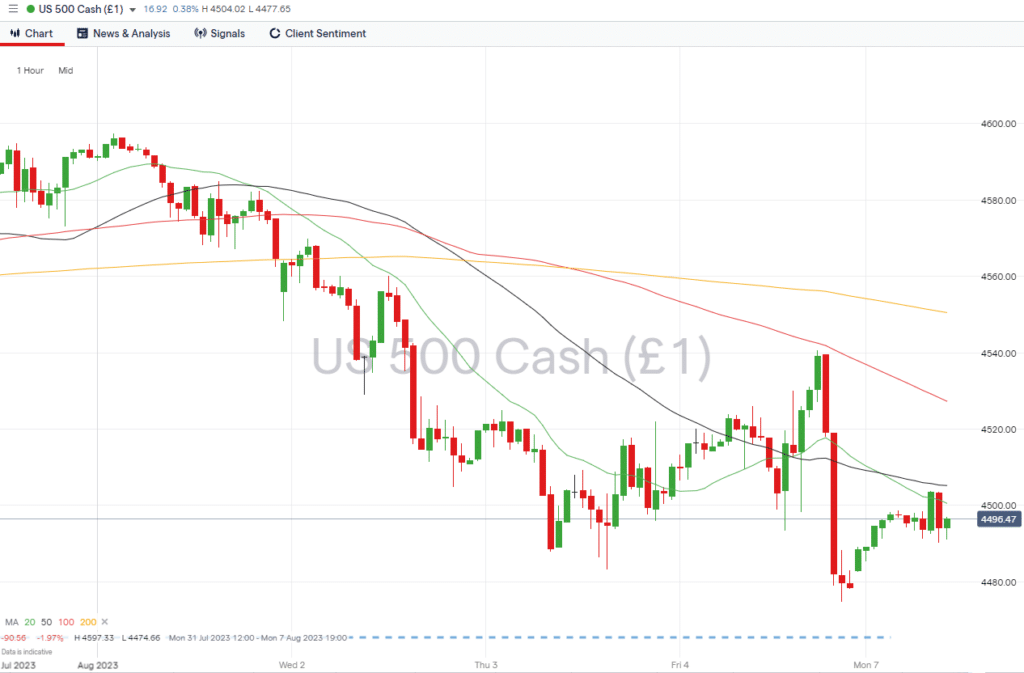
Source: IG
Short positions
- Entry Level 1: 4,458 – Price high of 30th June, which along with price high of 16th June marks resistance/support price level. Also, the region of the 50 SMA on the Daily Price Chart (4,459).
- Price Target 1: 4,510 – Region of the supporting trendline dating from 23rd March.
- Price Target 2: 4,312 – In extension, region of the 100 SMA on the Daily Price Chart.
- Stop Loss: > 4,607 – Year-to-date price high recorded on 27th July.
Long positions
- Entry Level 1: 4,450 – Buying into short-term price weakness, which takes price to the region of the 50 SMA on the Daily Price Chart and the resistance/support in the region of 4,458.
- Price Target 1: 4,538 – Region of the 20 SMA on the Daily Price Chart.
- Price Target 2: 4,607 –Year-to-date price high recorded on 27th July.
- Stop Loss: < 4,100 – Trendline support.
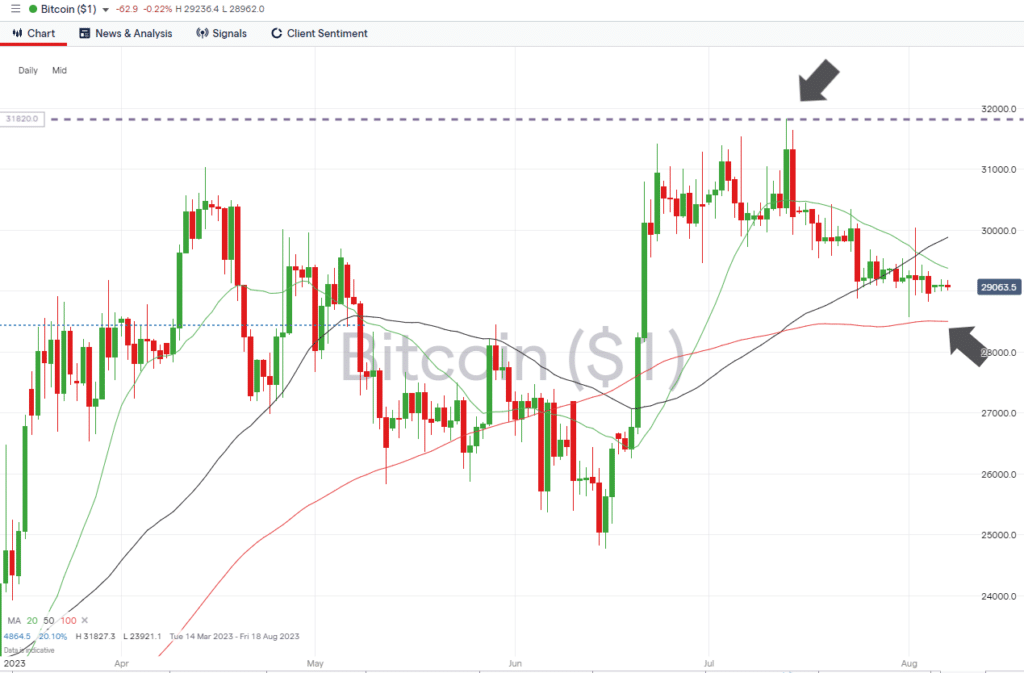
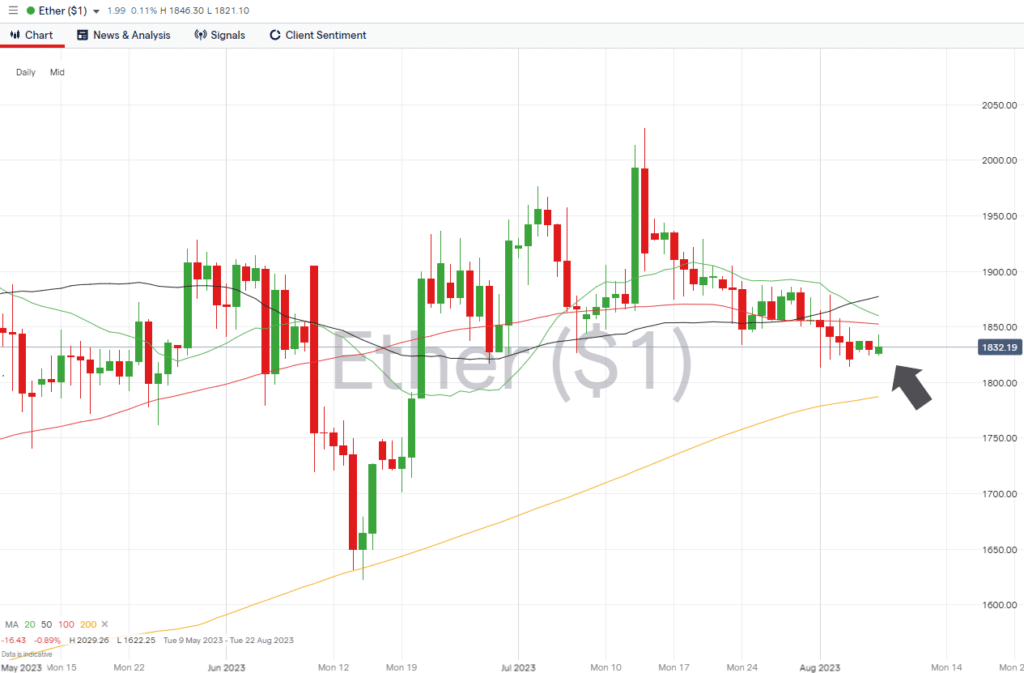
Crypto – Bitcoin & Ethereum
Price action in cryptoassets continues to form consolidation patterns. A lack of major news could see that extended this week with the prices of both coins continuing to fluctuate around key long-term moving averages.
Bitcoin Price Chart – Daily Price Chart
Source: IG
Bitcoin Long positions
- Entry Level 1: 29,371 – A break of the 20 SMA on the Daily Price Chart would suggest renewed upwards momentum. This metric now sits below the psychologically important 30k price level, which would allow some momentum to build before price tests the 30k price bar.
- Price Target 1: 31,827 – Current year-to-date price high printed on 13th July.
- Price Target 1: 36,180 – 50% Fib retracement level of the price rise that took place between March 2019 and November 2021.
- Stop Losses: < 28,499 – Region of the 100 SMA on the Daily Price Chart.
Ethereum
Ethereum Chart – Daily Price Chart
Source: IG
Ethereum Long positions
- Entry Level 1: 1,787 – Buying into weakness that takes price to the level of the 200 SMA on the Daily Price Chart. The 100 SMA, which is currently trading at 1,852, offers an alternative entry point.
- Price Target 1: 2,000 – Psychologically important ‘round number’ support/resistance level that acted as resistance on 13th and 14th July.
- Price Target 2: 2,141 – In extension, year-to-date price high printed on 16th April.
- Stop Losses: < 1,806 – This price level marks the 23.6% Fib retracement price of the 2022 price crash. It also sits just above the round number 1,800 price support level.
Risk Statement: Trading financial products carries a high risk to your capital, especially trading leverage products such as CFDs. They may not be suitable for everyone. Please make sure that you fully understand the risks. You should consider whether you can afford to take the risk of losing your money.

Forextraders' Broker of the Month
BlackBull Markets is a reliable and well-respected trading platform that provides its customers with high-quality access to a wide range of asset groups. The broker is headquartered in New Zealand which explains why it has flown under the radar for a few years but it is a great broker that is now building a global following. The BlackBull Markets site is intuitive and easy to use, making it an ideal choice for beginners.