
FOCUS ON: Busy Week for Data on the Underlying Health of the Economy
- Inflation and sentiment reports due out
- Minutes of the US Federal Reserve’s last meeting to be released
- Key technical support/resistance levels coming into play
Trading Ideas
We created this Weekly Tips section to share possible trade entry and exit points based on our technical analysis. We also have other methods to validate our trades which we can’t publicly share that help to increase their success. All our trades include entry and at least one target price. Stop losses are applied at the reader’s discretion. Our strategies typically trade with a wide stop loss, and risk is further mitigated by trading in small sizes.
Instrument | Price | Hourly | Daily |
GBP/USD | 1.2691 | Neutral | Strong Sell |
EUR/USD | 1.0945 | Neutral | Strong Sell |
USD/JPY | 142.18 | Sell | Strong Buy |
S&P 500 | 4,466 | Strong Sell | Sell |
NASDAQ 100 | 15,042 | Neutral | Strong Sell |
FTSE100 | 7,500 | Strong Buy | Sell |
Gold | 1,914 | Neutral | Strong Sell |
Crude Oil WTI | 81.85 | Strong Sell | Strong Buy |
Bitcoin | 29,353 | Strong Buy | Neutral |
Ethereum | 1,845 | Strong Buy | Neutral |
UTC: 08:38
US Dollar Basket Index (DXY)
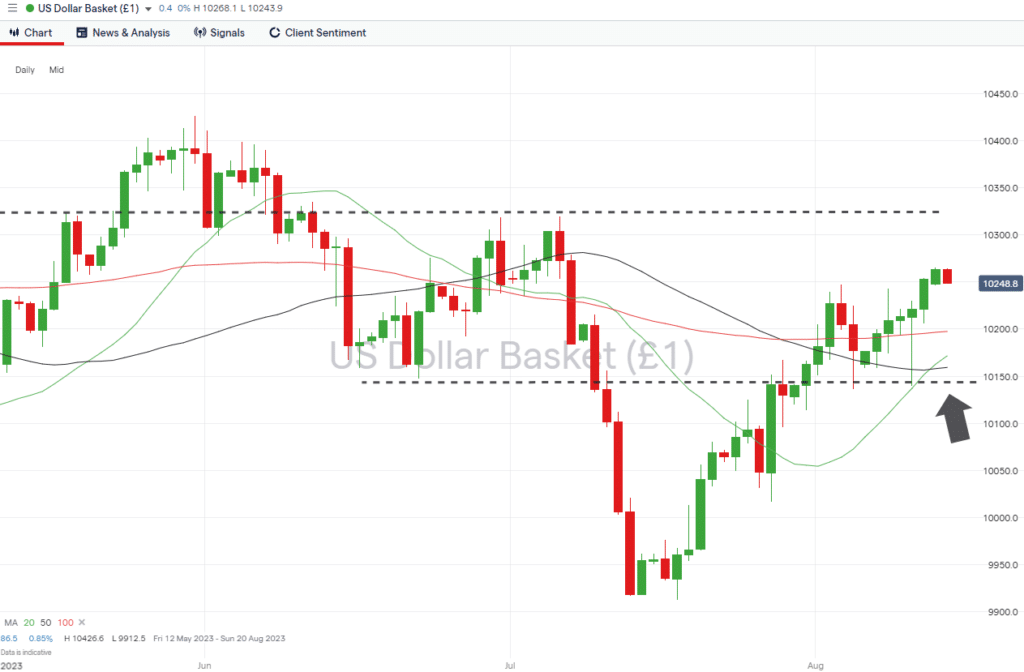
The rally in the price of the US Dollar Basket Index, which started on 13th July, has been slow and steady in nature, and the RSI on the Daily Price Chart now sits at 60.9. That leaves room for further upward movement before the index is considered overbought on that timeframe. The release of the minutes of the last meeting of the FOMC can be expected to trigger price moves as analysts consider the Fed’s next steps in terms of interest rate levels.
US Dollar Basket Chart – Daily Price Chart
Source: IG
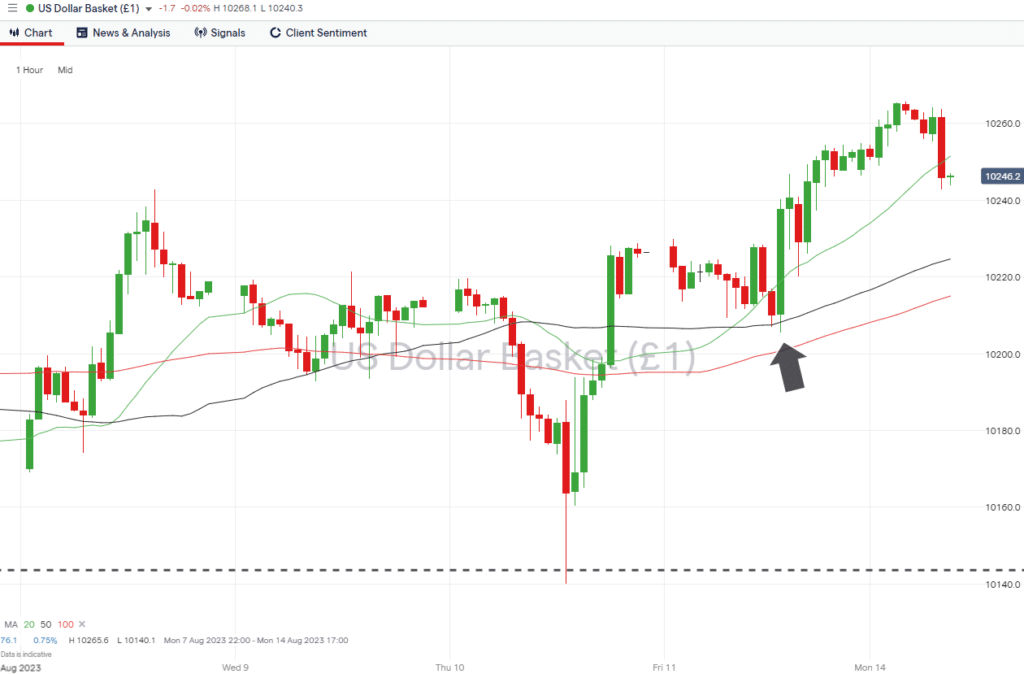
US Dollar Basket Chart – Hourly Price Chart
Source: IG
Short positions
- Entry Level 1: 103.20 – With upward momentum being the major theme of the DXY index, those looking to short sell might wait until price reaches the resistance level formed by the price high of Thursday 6th July.
- Price Target 1: 101.97 – Region of the 100 Simple Moving Average on the Daily Price Chart.
- Price Target 2: 101.40 –– In extension, intraday price low recorded on 10th August. A break of this swing-low would confirm a shift to bearish price action.
- Stop Loss: > 104.26 – Price high printed on Wednesday 31st May.
Long positions
- Entry Level 1: 102.24 – Region of the 50 SMA on the Hourly Price Chart. Provided support at the time of the US market open on 11th August.
- Price Target 1: 103.20 – Intraday price high recorded on 6th July.
- Price Target 2: 104.26 – In extension, multi-month price high printed on 31st May.
- Stop Loss: < 101.97 – Region of the 100 SMA on the Daily Price Chart.
GBPUSD
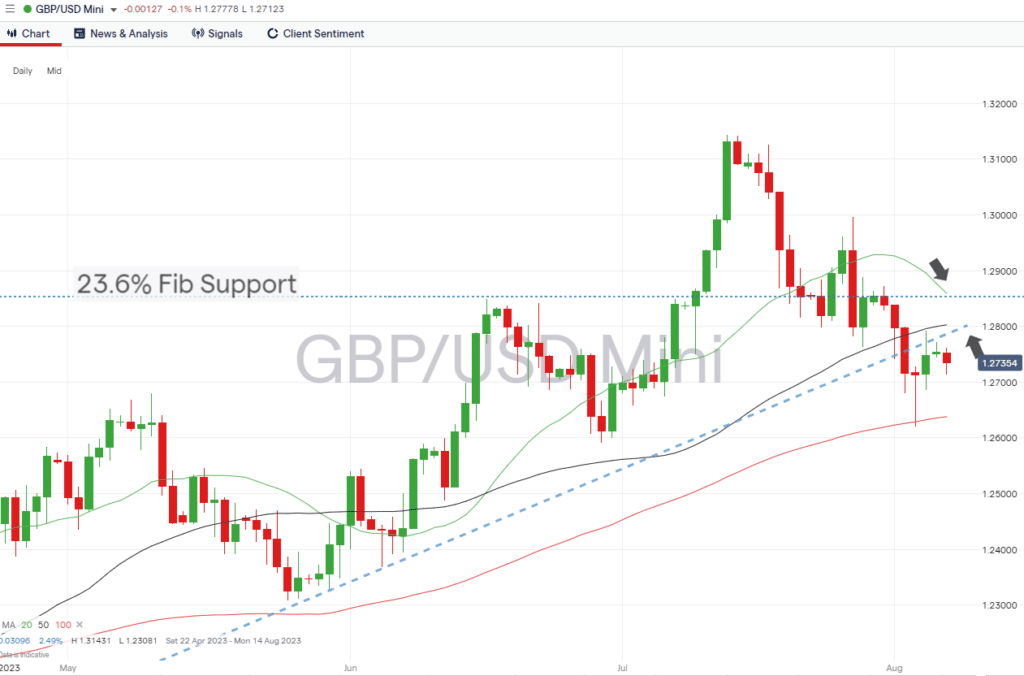
GBPUSD had been trading into the funnel of a wedge pattern formed by the 23.6% Fibonacci retracement level of the multi-year downward price move from November 2007 to September 2022 and the supporting trendline of the price move, which started in September 2022. The break of the trendline on 2nd August, and subsequent retest of that resistance/support level on 7th August, points towards downward momentum now being confirmed.
Daily Price Chart – GBPUSD Chart – Daily Price Chart – Wedge Pattern
Source: IG
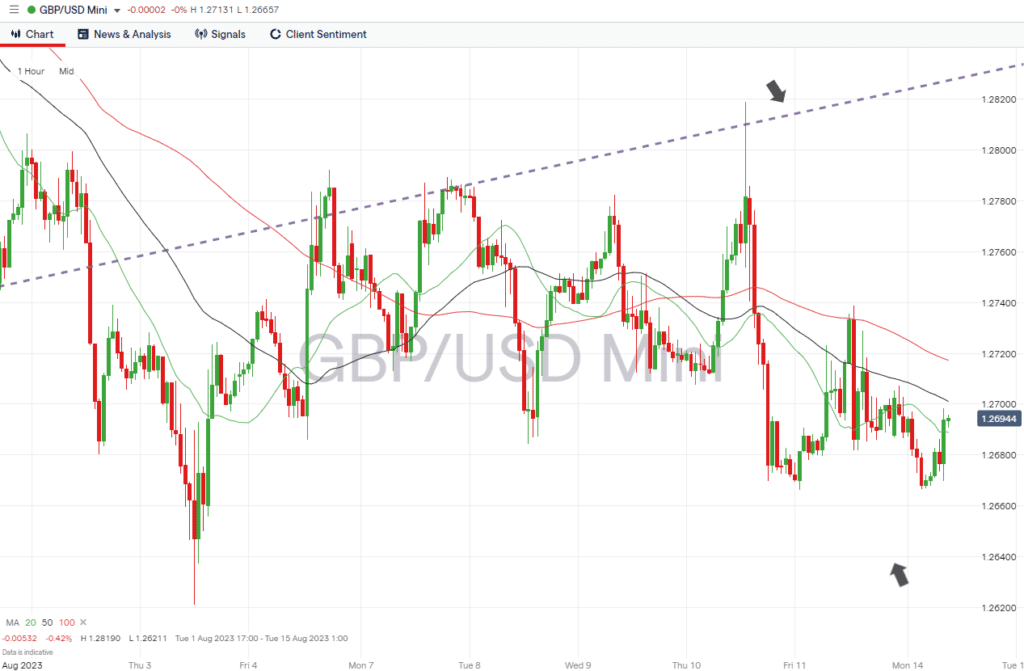
GBPUSD Chart – Hourly Price Chart
Source: IG
Short positions
- Entry Level 1: 1.26549 – The 100 SMA on the Daily Price Chart acted as support on 3rd August, but a break below that level would be a signal for trend traders to target further downward price movements.
- Price Target 1: 1.5911 – Swing-low price point recorded on 29th June.
- Price Target 2: 1.24236 – Region of the 200 SMA on the Daily Price Chart.
- Stop Loss: > 1.28539 – The 23.6% Fib retracement level sits above the 20 and 50 SMAs on the Daily Price Chart.
Long positions
- Entry Level 1: 1.26549 – Buying into weakness which takes price to the region of the 100 SMA on the Daily Price Chart.
- Price Target 1: 1.27782 – A break through the 20 SMA on the Daily Price Chart would confirm the upward trend still has momentum.
- Price Target 2: 1.28539 – Long-term 23.6% Fib retracement level.
- Price Target 3: 1.3000 – Psychologically important ‘round number’ price level.
- Stop Loss: < 1.26211 – August month-to-date price low.
EURUSD
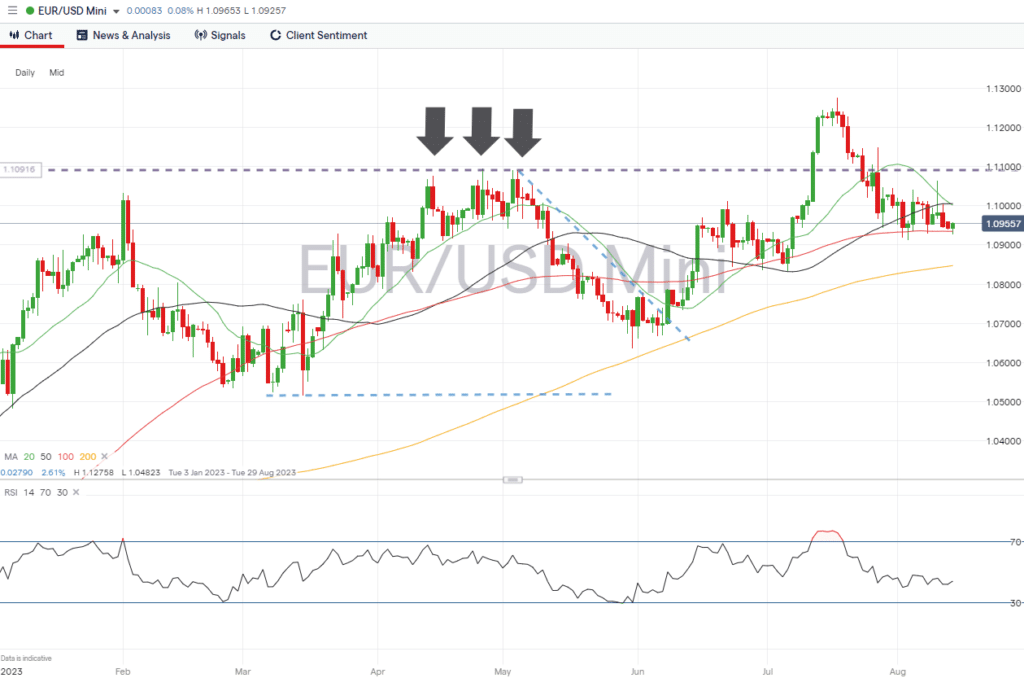
EURUSD currently sits between two key support/resistance levels. To the upside is the double-top price pattern which has been forming through the first half of the year. Support is offered by the 100 SMA on the Daily Price Chart, which has been tested several times through August, but which price has still failed to close below. The RSI on the Daily Price Chart is printing in the region of 44.1, leaving room for new upward or downward price trends to form; however, continued price consolidation is an equally likely outcome.
EURUSD Chart – Daily Price Chart
Source: IG
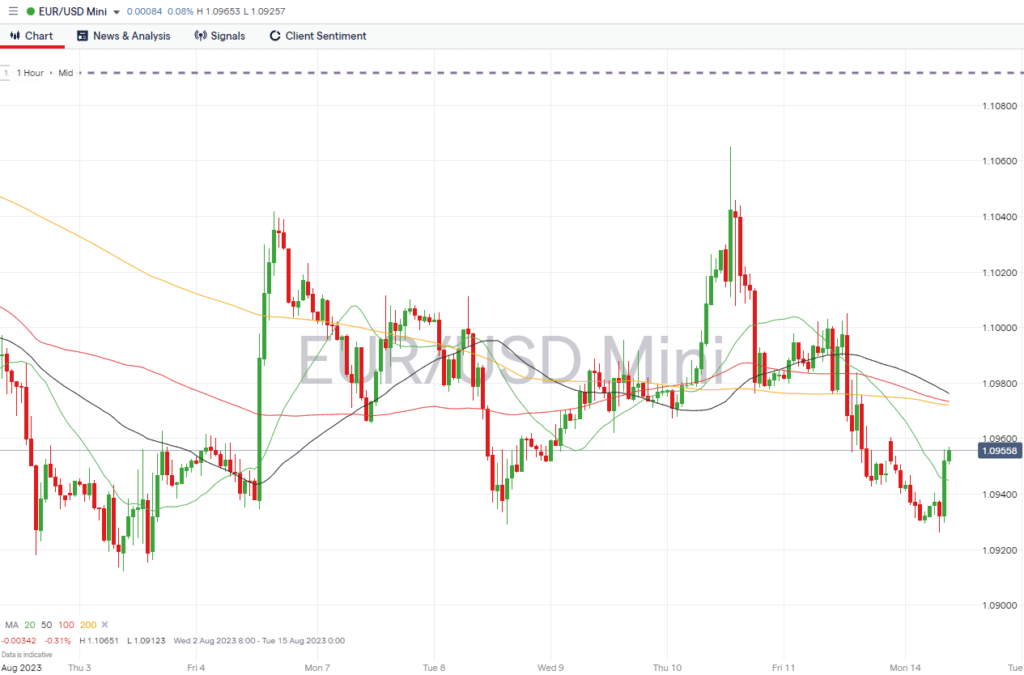
EURUSD Chart – Hourly Price Chart
Source: IG
Short positions
- Entry Level 1: 1.09721 – The convergence of the 50, 100, and 200 SMAs on the Hourly Price Chart is likely to generate price resistance in the region between 1.09721 and 1.09762.
- Price Target 1: 1.09449 – Region of the 20 SMA on the Hourly Price Chart. Scalping strategy aiming to take advantage of consolidation price patterns.
- Price Target 2: 1.09348 – In extension, region of the 100 SMA on the Daily Price Chart.
- Stop Loss: > 1.10918 – Price high of 3rd May, along with the other price highs of May, forms part of a potential double-top price pattern.
Long positions
- Entry Level 1: 1.09348 – Buying into short-term weakness, which takes price to the region of the 100 SMA on the Daily Price Chart. GBPUSD has closed above this key metric since 6th July.
- Price Target 1: 1.10054 – Region of the 50 SMA on the Daily Price Chart, also the 20 SMA, which sits at 1.10017 and the psychologically important 1.100 price level.
- Price Target 2: 1.10918 – Price high of 3rd May. Double-top price point.
- Stop Loss: < 1.09123 – Tight stop loss offered by the swing-low price recorded on Thursday 3rd August.
Indices
S&P 500
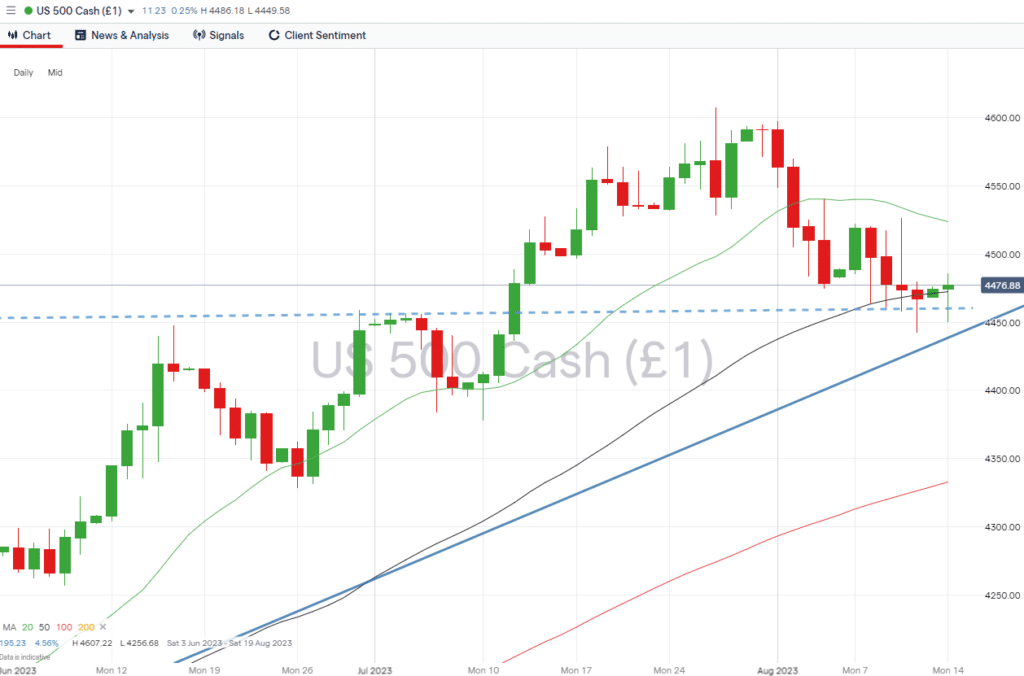
Stock investors have taken a more risk-off approach through August, which has taken price down to key support levels. The 50 SMA on the Daily Price Chart (4472) sits just above the supporting trendline of the bull run that started in March 2023.
S&P 500 Chart – Daily Price Chart – Key Support Levels
Source: IG
S&P 500 – Hourly Price Chart
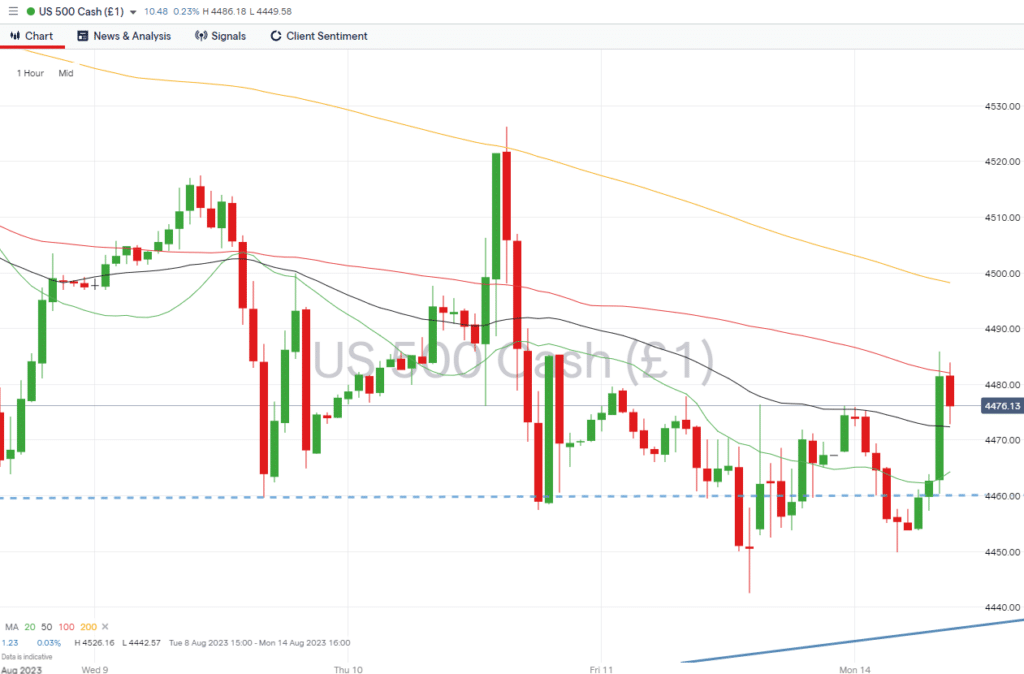
Source: IG
Short positions
- Entry Level 1: 4,472 – Price has failed to close below the 50 SMA on the Daily Price Chart since 29th March. A break of that key metric would open the door to further downward price moves.
- Price Target 1: 4,450 – Region of the supporting trendline dating from 23 March.
- Price Target 2: 4,332 – In extension, region of the 100 SMA on the Daily Price Chart.
- Stop Loss: > 4,523 – Region of the 20 SMA on the Daily Price Chart.
Long positions
- Entry Level 1: 4,472 – As long as the 50 SMA on the Daily Price Chart continues to provide support, it will provide a platform for those looking to go long on the world’s most important stock index.
- Price Target 1: 4,523 – Region of the 20 SMA on the Daily Price Chart.
- Price Target 2: 4,607 –In extension, the year-to-date price high recorded on 27th July.
- Stop Loss: < 4,450 – Trendline support.
Crypto – Bitcoin & Ethereum
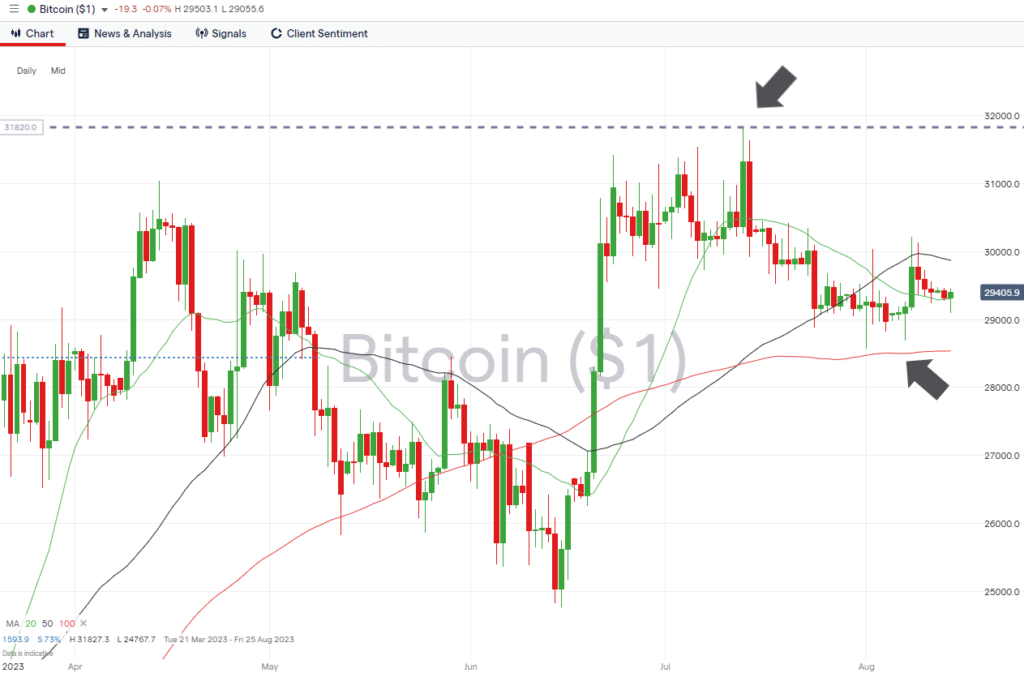
Crypto investors in long positions can continue to take positive signs about how price in the major coins continues to track key Simple Moving Averages. Bitcoin and Ethereum have been forming consolidation patterns for several months, and last week both coins posted gains, with BTC up 1.05% and ETH up 0.76%
Bitcoin Price Chart – Daily Price Chart
Source: IG
Bitcoin Long positions
- Entry Level 1: 29,304 – While price continues to trade above the 20 SMA on the Daily Price Chart, there is room for further upward momentum.
- Price Target 1: 29,869 – Region of the 50 SMA on the Daily Price Chart sits just below the ‘round number’ 30k price level.
- Price Target 2: 31,827 – Current year-to-date price high printed on 13th July.
- Price Target 1: 36,180 – In extension, 50% Fib retracement level of the price rise that took place between March 2019 and November 2021.
- Stop Losses: < 28,539 – Region of the 100 SMA on the Daily Price Chart.
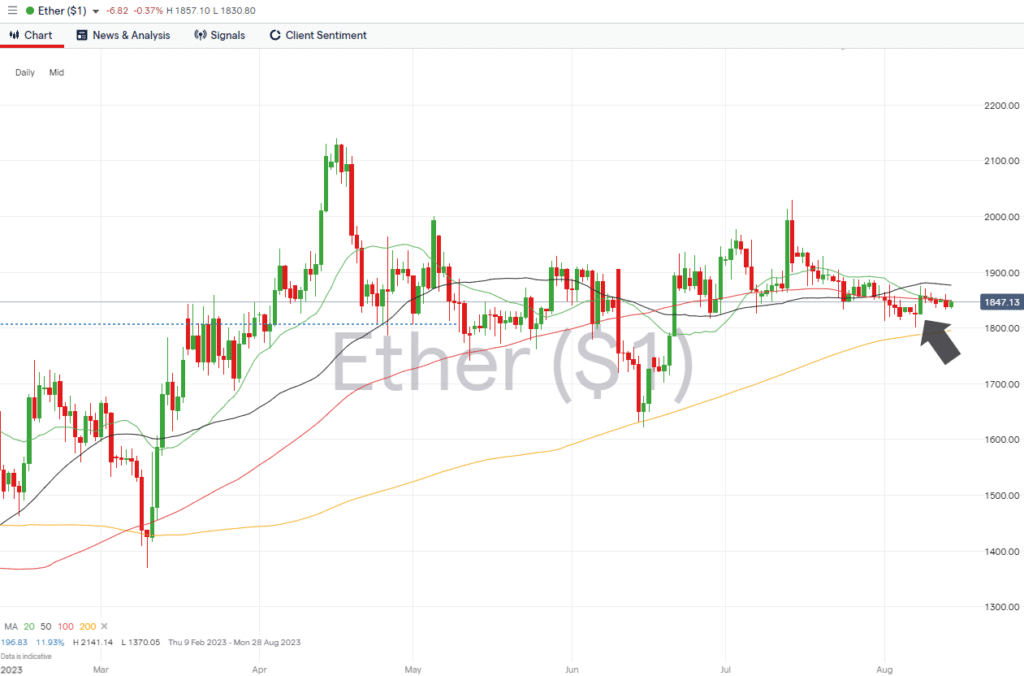
Ethereum
Ethereum Chart – Daily Price Chart
Source: IG
Ethereum Long positions
- Entry Level 1: 1,848 – Region of the 20 SMA on the Daily Price Chart. The 100 SMA, currently trading at 1,849, offers an alternative entry point.
- Price Target 1: 2,000 – Psychologically important ‘round number’ support/resistance level, which acted as resistance on the 13th and 14th July.
- Price Target 2: 2,141 – In extension, the year-to-date price high printed on 16th April.
- Stop Losses: < 1,806 – This price level marks the 23.6% Fib retracement price of the 2022 price crash. It also sits just above the round number 1,800 price support level.
Risk Statement: Trading financial products carries a high risk to your capital, especially trading leverage products such as CFDs. They may not be suitable for everyone. Please make sure that you fully understand the risks. You should consider whether you can afford to risk losing your money.

Forextraders' Broker of the Month
BlackBull Markets is a reliable and well-respected trading platform that provides its customers with high-quality access to a wide range of asset groups. The broker is headquartered in New Zealand which explains why it has flown under the radar for a few years but it is a great broker that is now building a global following. The BlackBull Markets site is intuitive and easy to use, making it an ideal choice for beginners.