
FOCUS ON: Jackson Hole Symposium and Risk Appetite
- Central Banker’s Jackson Hole Symposium starts Thursday
- Decisions makers convene at a time when markets begin to look bearish
- Updates from leaders likely to trigger further moves
Trading Ideas
We created this Weekly Tips section to share possible trade entry and exit points based on our technical analysis. We also have other methods to validate our trades which we can’t publicly share that help to increase their success. All our trades include entry and at least one target price. Stop losses are applied at the reader’s discretion. Our strategies typically trade with a wide stop loss, and risk is further mitigated by trading in small sizes.
Instrument | Price | Hourly | Daily |
GBP/USD | 1.2745 | Neutral | Neutral |
EUR/USD | 1.0888 | Strong Buy | Strong Sell |
USD/JPY | 145.39 | Strong Buy | Strong Buy |
S&P 500 | 4,374 | Strong Sell | Strong Sell |
NASDAQ 100 | 14,715 | Neutral | Strong Sell |
FTSE100 | 7,270 | Strong Sell | Strong Sell |
Gold | 1,889 | Strong Sell | Strong Sell |
Crude Oil WTI | 81.24 | Strong Buy | Buy |
Bitcoin | 25,968 | Strong Sell | Strong Sell |
Ethereum | 1,668 | Strong Sell | Strong Sell |
UTC: 08:32
US Dollar Basket Index (DXY)
After a multi-week rally which started on 13th July, the US Dollar Basket Index has met resistance in the form of the price high of 103.20 recorded on 6th July. The RSI on the Daily Price Chart breached 70 last week, and while now sitting at 63.8, there are signs that the index is overbought on that timeframe. The meeting of world central bankers at the Jackson Hole Symposium will be keenly studied by analysts trying to determine if the current bull run in the greenback will be extended.
US Dollar Basket Chart – Daily Price Chart
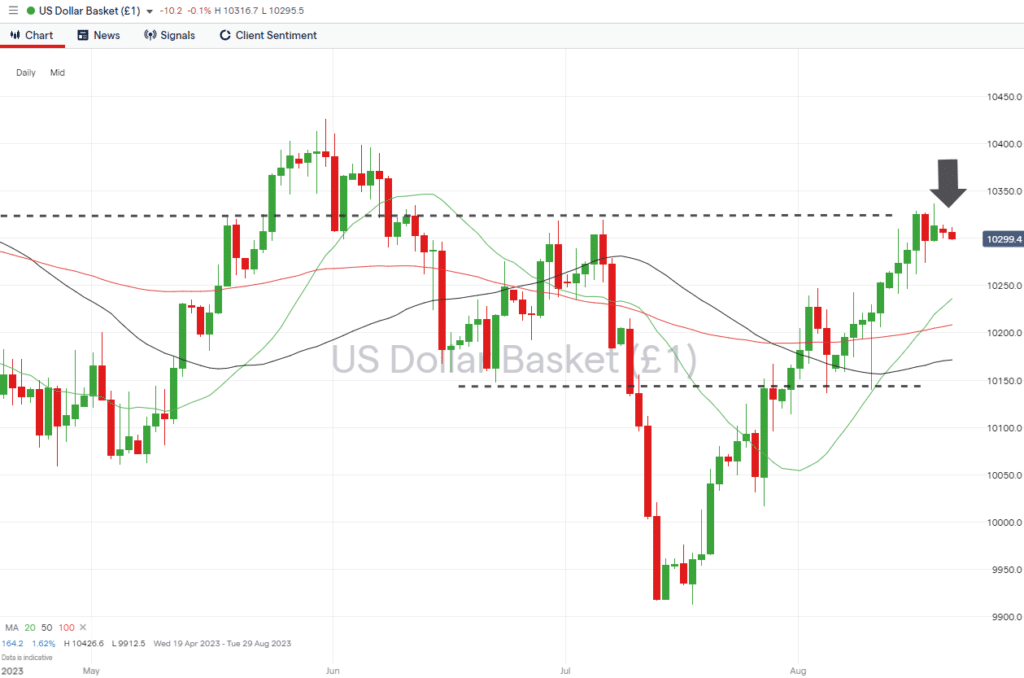
Source: IG
US Dollar Basket Chart – Hourly Price Chart
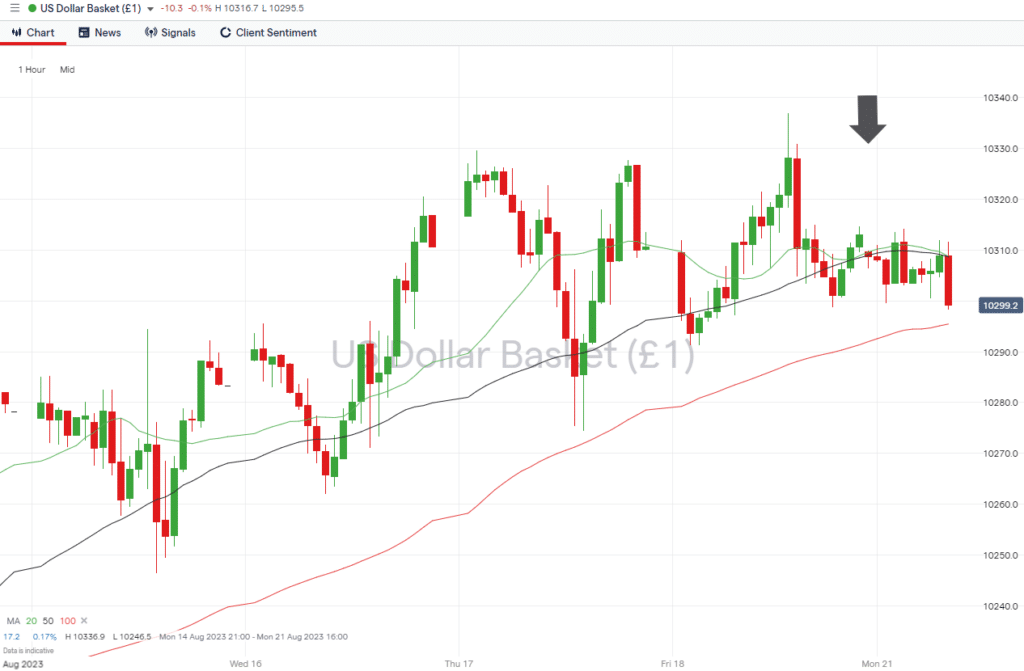
Source: IG
Short positions
- Entry Level 1: 103.20 – Upward momentum in the DXY index last week resulted in price touching and retreating from the resistance level formed by the price high of Thursday 6th July. The 103.20 price bar still looks like a level at which to short the dollar.
- Price Target 1: 102.36 – Region of the 20 SMA (Simple Moving Average) on the Daily Price Chart.
- Price Target 2: 101.40 –– In extension, this intraday price low recorded on 10th August forms a swing-low pattern, and a break of it would confirm a shift towards bearish price action.
- Stop Loss: > 104.26 – Price high printed on Wednesday 31st May.
Long positions
- Entry Level 1: 103.20 – A break above the key resistance level would leave room for further momentum to build.
- Price Target 1: 103.36 – Intraday price high recorded on 6th July.
- Price Target 2: 104.26 – In extension, multi-month price high printed on 31st May.
- Stop Loss: < 102.08 – Region of the 100 SMA on the Daily Price Chart.
GBPUSD
The sell-off in GBPUSD, which started in mid-July, has still failed to break the 100 SMA on the Daily Price Chart. While that level holds the fall from the highs of 1.31431 can still be considered a short-term retracement. The major obstacle to upward price movement remains the 23.6% Fibonacci retracement level of the multi-year downward price move from November 2007 to September 2022.
Daily Price Chart – GBPUSD Chart – Daily Price Chart
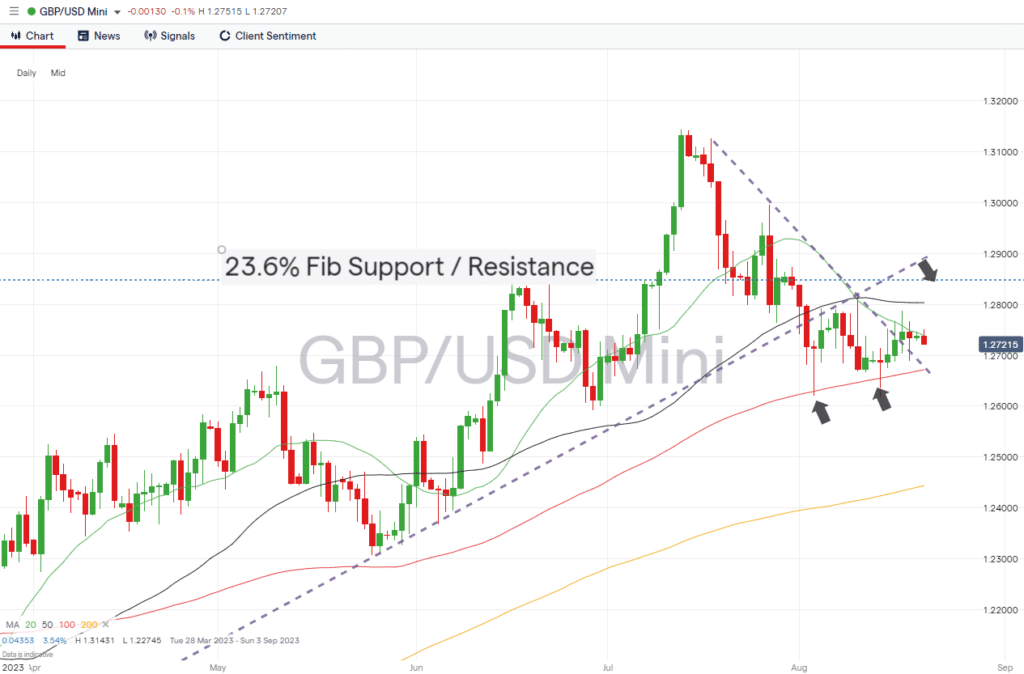
Source: IG
GBPUSD Chart – Hourly Price Chart
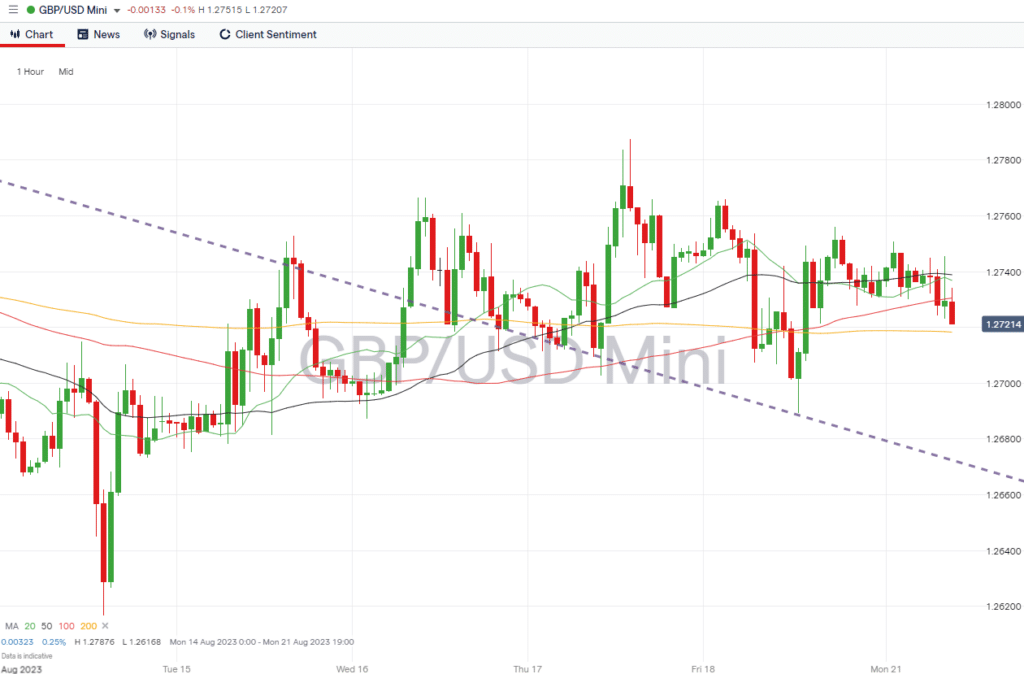
Source: IG
Short positions
- Entry Level 1: 1.27382 – Price has failed to close above the 20 SMA on the Daily Price Chart since 27th July. That continues to make it a likely entry point for those predicting further weakness in the pound.
- Price Target 1: 1.26714 – Region of the 100 SMA on the Daily Price Chart.
- Price Target 2: 1.25911 – Swing-low price point recorded on 29th June.
- Stop Loss: > 1.28539 – The 23.6% Fib retracement level which sits above the 50 SMA on the Daily Price Chart.
Long positions
- Entry Level 1: 1.26714 – Region of the 100 SMA on the Daily Price Chart which also intersects the downward 0 trendline which dates back to 18th July.
- Price Target 1: 1.27382 – 20 SMA on the Daily Price Chart.
- Price Target 2: 1.28539 – 23.6% Fib retracement level of long-term price trend.
- Price Target 3: 1.3000 – Psychologically important ‘round number’ price level.
- Stop Loss: < 1.26211 – Month-to-date price low printed on 3rd August.
EURUSD
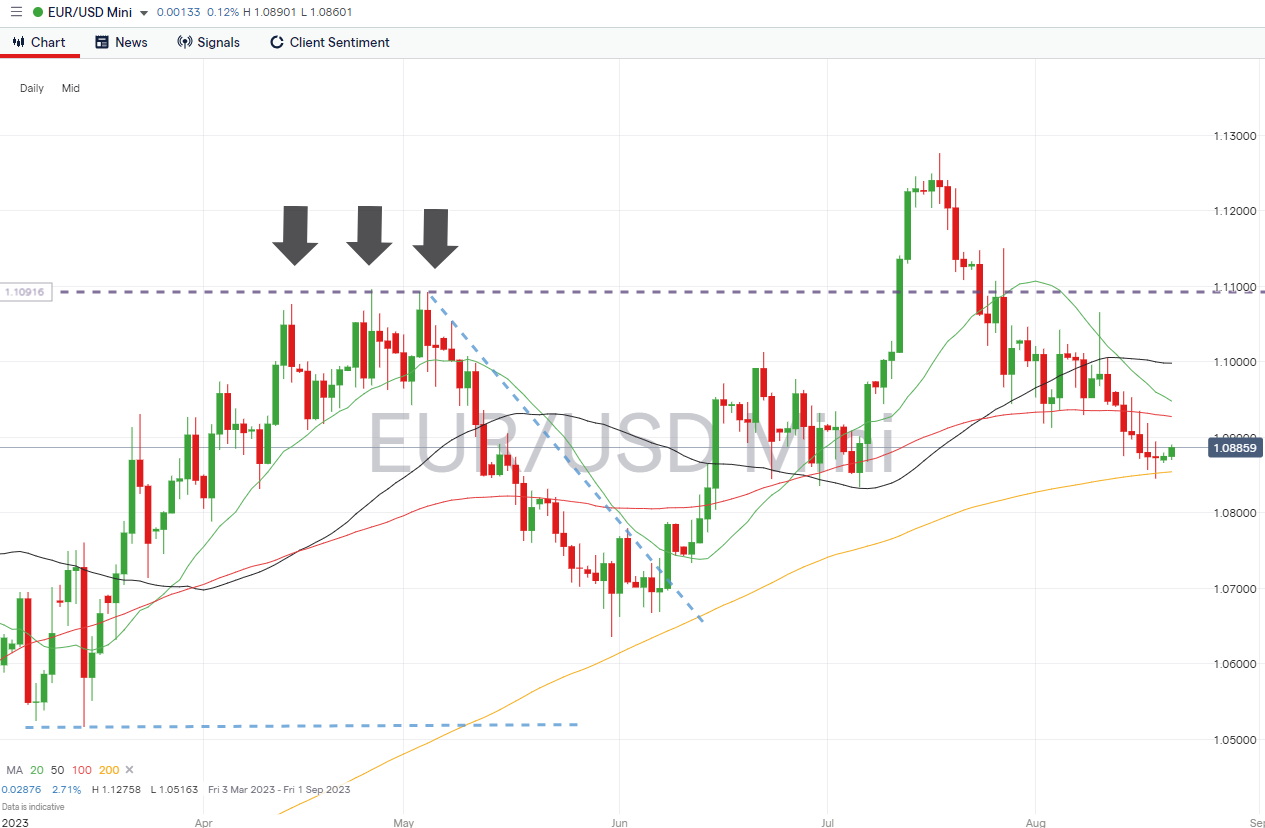
The Eurodollar’s break of the 100 SMA on the Daily Price Chart could signal further downward price movement. That metric was tested several times throughout early August and was finally breached last week. To the upside is the resistance offered by the double-top price pattern, which dates back to the first half of the year.
EURUSD Chart – Daily Price Chart
Source: IG
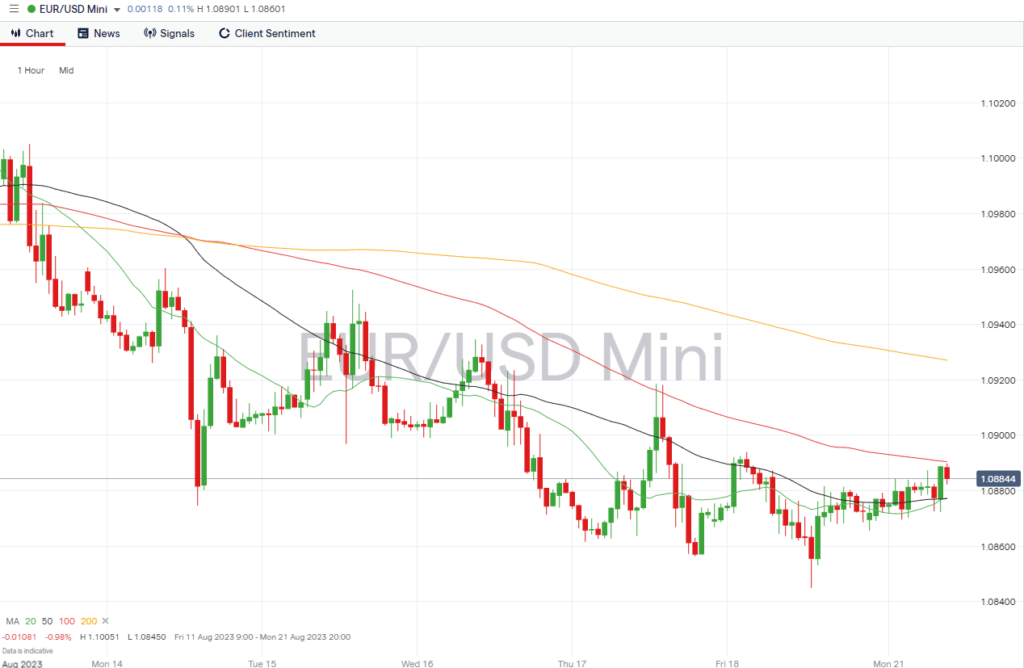
EURUSD Chart – Hourly Price Chart
Source: IG
Short positions
- Entry Level 1: 1.09270 – Region of the 100 SMA on the Daily Price Chart. Previously acted as support and is now likely to provide resistance.
- Price Target 1: 1.08539 – Region of the 200 SMA on the Daily Price Chart.
- Stop Loss: > 1.10918 – Price high of 3rd May, which along with the other price highs recorded in the first half of the year, forms a potential double-top price pattern.
Long positions
- Entry Level 1: 1.08539 – Buying into short-term weakness, which takes price to the region of the 200 SMA on the Daily Price Chart. GBPUSD has closed above this key metric since 6th July.
- Price Target 1: 1.09270 – 100 SMA on the Daily Price Chart.
- Price Target 2: 1.10918 – Price high of 3rd May. Double-top price point.
- Stop Loss: < 1.08450 – With few support levels below the 200 SMA, it could be worth applying a tight stop loss using the price low of 18th August as a guide.
Indices
S&P 500
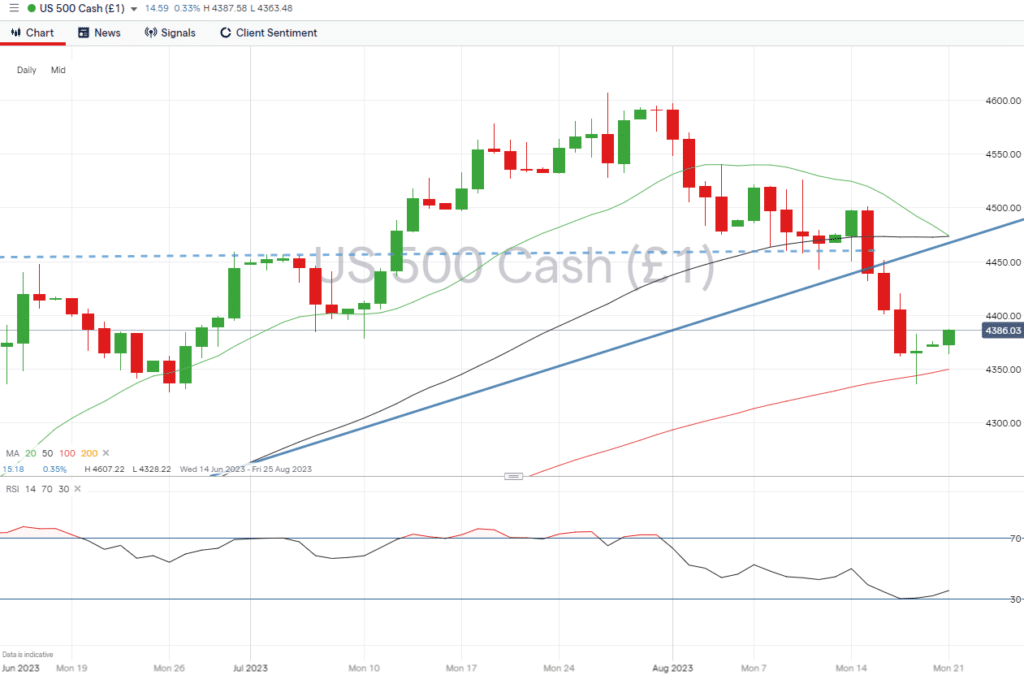
The bounce off the 100 SMA on the Daily Price Chart could signal a turning point for stocks which have so far had a torrid August. The S&P 500 index has given up more than 4% in value in the space of three weeks, and with the RSI on the Daily Price Chart sitting at 35.6, there are signs that the market could be oversold on that timeframe.
S&P 500 Chart – Daily Price Chart – 100 SMA
Source: IG
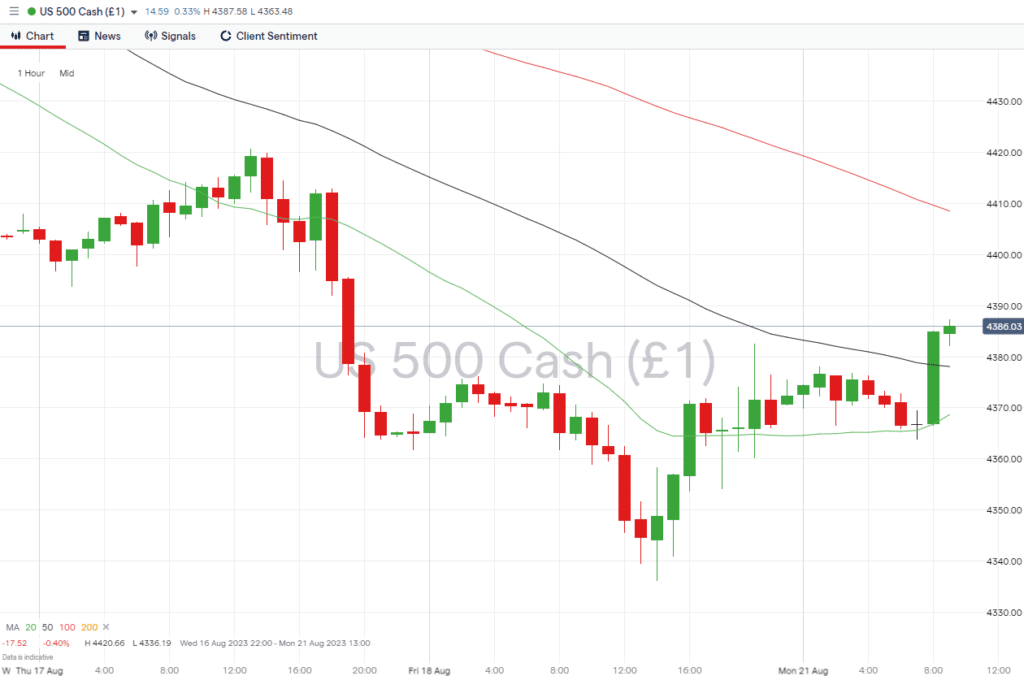
S&P 500 – Hourly Price Chart
Source: IG
Short positions
- Entry Level 1: 4,349 – A confirmed break of the 100 SMA on the Daily Price Chart would signal further bearish price movement is likely.
- Price Target 1: 4,328 – Swing low price level recorded on 26th June.
- Price Target 2: 4,186 – In extension, region of the 200 SMA on the Daily Price Chart.
- Stop Loss: > 4,473 – Region of the 20 and 50 SMAs and the supporting trendline dating from 23 March.
Long positions
- Entry Level 1: 4,349 – As long as the 100 SMA on the Daily Price Chart continues to provide support, it will provide an entry point for those looking to go long on the world’s major stock index.
- Price Target 1: 4,523 – 4,473 – Region where there is a convergence of the 20 and 50 SMAs and the supporting trendline dating from 23 March.
- Stop Loss: < 4,336 – Intraday price low recorded on 18th August.
Crypto – Bitcoin & Ethereum
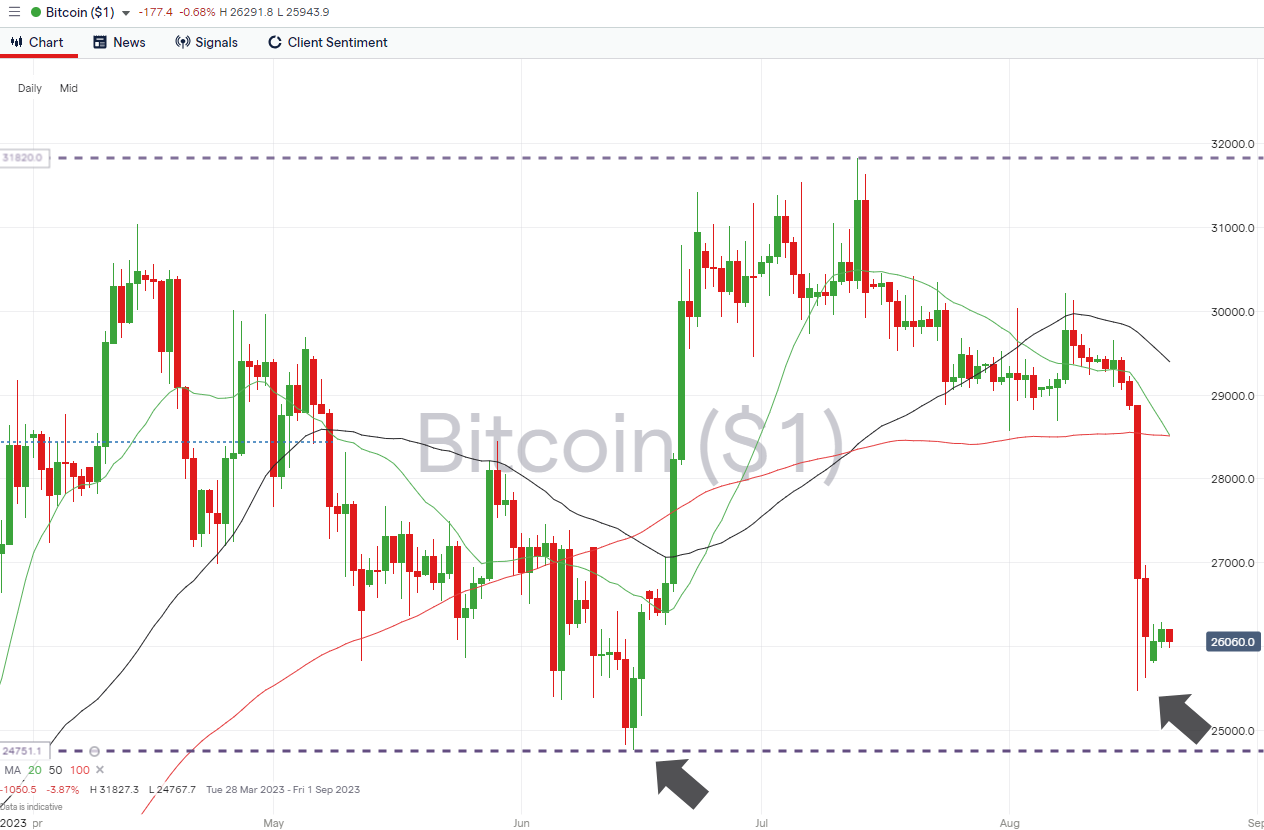
Crypto prices were hammered last week in what some are calling a flash crash. The cause of the +10% price fall is hard to pinpoint, but many blame the news that Elon Musk’s Space X operation has downgraded the value of its Bitcoin investment and sold a significant amount of its holding in the market.
Bitcoin Price Chart – Daily Price Chart
Source: IG
Bitcoin Long positions
- Entry Level 1: 24,767 – Important price low printed on 15th June. As long as price continues to trade above that swing-low price level, there is strength to the argument that last week’s price crash is a short-term event.
- Price Target 1: 28,512 – Convergence of the 20 and 100 SMAs on the Daily Price Chart.
- Price Target 2: 31,827 – In extension, current year-to-date price high printed on 13th July.
- Stop Losses: < 24,767 – Tight stop loss due to few support levels being within close proximity.
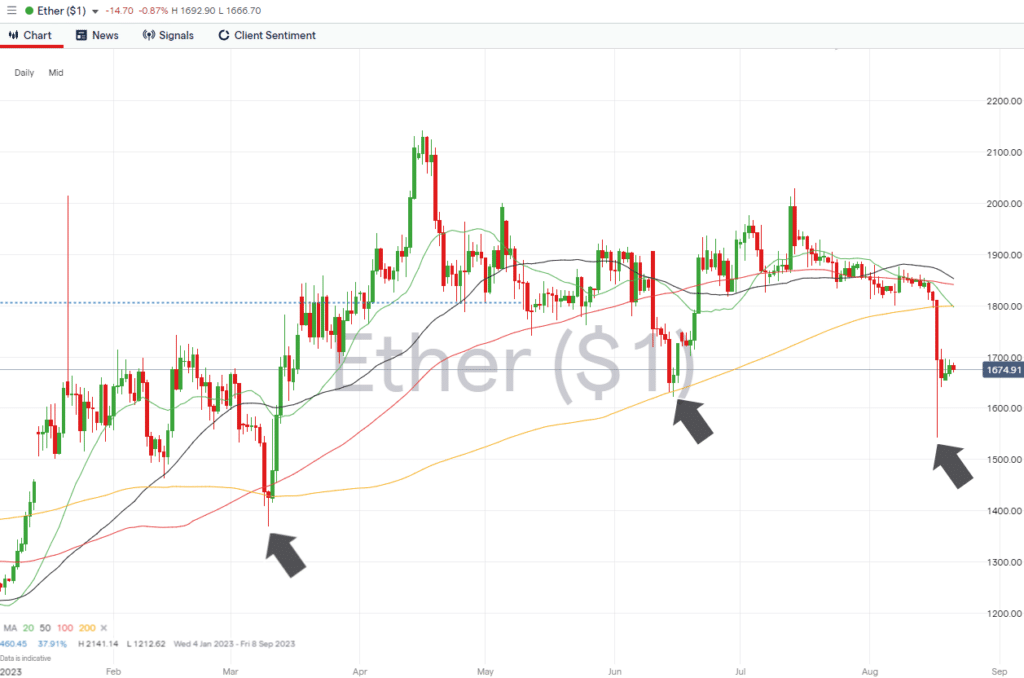
Ethereum
Ethereum Chart – Daily Price Chart
Source: IG
Ethereum Long positions
- Entry Level 1: 1,622 – Support level marked by price low recorded on 15th June when price rebounded off the 200 SMA on the Daily Price Chart.
- Price Target 1: 1,800 – Convergence of the 20 and 200 SMAs on the Daily Price Chart.
- Price Target 2: 2,000 – Psychologically important ‘round number’ price level which acted as resistance on 13th and 14th July.
- Price Target 3: 2,141 – In extension, year-to-date price high printed on 16th April.
- Stop Losses: < 1,370 – Price low of 10th March.
Risk Statement: Trading financial products carries a high risk to your capital, especially trading leverage products such as CFDs. They may not be suitable for everyone. Please make sure that you fully understand the risks. You should consider whether you can afford to risk losing your money.

Forextraders' Broker of the Month
BlackBull Markets is a reliable and well-respected trading platform that provides its customers with high-quality access to a wide range of asset groups. The broker is headquartered in New Zealand which explains why it has flown under the radar for a few years but it is a great broker that is now building a global following. The BlackBull Markets site is intuitive and easy to use, making it an ideal choice for beginners.