

Introduction
Welles Wilder developed the “Average True Range” or “ATR” indicator to measure the volatility of price changes, initially for the commodities market where volatility is more prevalent. However, it is now widely used by forex traders as well. Traders rarely use the indicator to discern future price movement directions but use it to gain a perception of what recent historical volatility is to prepare an execution plan for trading. Setting stops and entry points at beneficial levels to prevent being stopped out or whipsawed are seen as benefits of this indicator.
Mr Wilder was born in 1935 in Norris, Tennessee. He lived to 86, having passed away in 2021. He was an engineer by trade and spent much of his career developing real estate. However, in the trading community, he is best known for being a significant contributor in the Technical Analysis arena. The ATR is one of his creations, but his most revered indicator may be the Relative Strength Index (RSI). He also created the Average Directional Index and the Parabolic SAR. In 1980, Forbes Magazine recognised Wilder as “the premier technical trader publishing his work today”. His famous counsel for beginning traders was succinct and to the point: “If you can’t deal with emotion, get out of trading.”
The ATR is classified as an Oscillator since the resulting curve fluctuates between values calculated based on the level of price volatility over a selected period. It is not a leading indicator in that it divulges nothing related to price direction. High values suggest that stops be wider, as well as entry points, to prevent having the market move quickly against you. With a percentage of the ATR reading, the trader can effectively act with orders involving proportionate sizing levels customised for the currency at hand.
Veteran traders have learned that the ATR is a wonderful tool for predicting breakouts and breakdowns in pricing behaviour for your chosen asset. A sudden change in the ATR signals that investors are committed to following through with buy and sell orders. It is widely used in forex trading and other venues because of its usefulness, but it should never be used by itself. It is best to combine it with one to two other indicators to assess how the market is reacting at a given moment.
In the above introductory example, the ATR Indicator is shown at the bottom of the chart. It is teamed up with Bollinger Bands (BB), which appear directly overlaid on the pricing chart. Both the ATR and the BB indicator overlay are considered measures of volatility. Each indicator is a harbinger of increasing activity in the market. The ATR values begin to rise as prices fall or rise in a trending fashion. The B-Bands also expand or contract as price volatility ebbs and flows.
When choosing an additional indicator to work in tandem with the ATR, it is advisable to select one of the popular momentum oscillators designed to forecast overbought and oversold conditions. If we stick with Mr Wilder’s creations, then a wise choice would be the Relative Strength Index, or RSI, as it is commonly referred to on trading platforms.
The ATR is also known for assisting traders in quickly choosing the appropriate gap to place a stop-loss order. If you practice with the ATR on your demo system, experiment with various stop-loss positions to ensure that you stay in the trade at initiation and not get gobbled up when a large trader goes searching for nearby sell orders. Depending on your risk appetite, you may find the right gap is anywhere from 25% to 40% of the prevailing ATR.
In any event, you can build a competent trading strategy around the Average True Range indicator when combined with other technical techniques. Examples will be provided below, but the best thing to do is to set aside practice time on a demo system to get acquainted with how the ATR reacts under market conditions. You may want to vary ATR parameters to see what works best for you and your trading style while fine-tuning your Average True Range strategy.
How is the ATR Indicator calculated?
What is the ATR indicator formula? The ATR indicator is common on MetaTrader4 trading software and is a standard feature on other trading platforms. The calculation formula sequence attempts to remove the impacts of gaps between market closings to establish absolute ranges for each given period, whether for a minute or a day or whatever chart time you choose. These steps are as follows:
- For each period chosen, calculate three “absolute” values: a) the “High” minus the “Low”, b) the “High” minus the previous period’s “Close”, and c) the previous period’s “Close” minus the “Low”.
- The “True Range”, or TR, is the greatest of the three previous calculations.
- The ATR is the moving average over the chosen period length. The typical length setting is “14”.
These calculations may appear complicated and tedious, but the intention is to record a positive value for each period. There are no negatives since the absolute value requirement keeps all signs positive. You also need not worry about how difficult the computations might appear. Software programs perform the necessary computational work instantaneously.
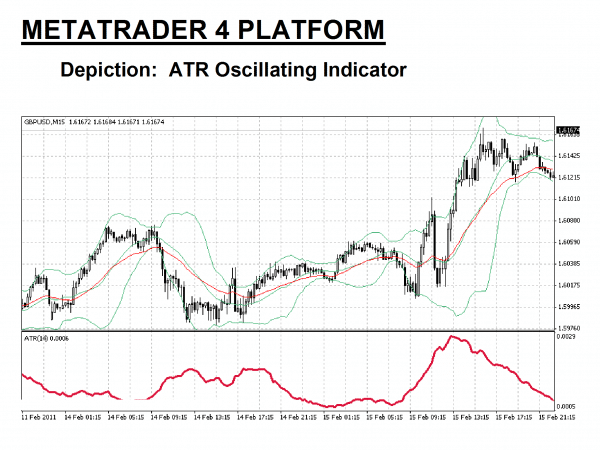
The ATR indicator is composed of a single fluctuating curve. In the example of the “GBP/USD” currency pair depicted below, the ATR indicator range is between 5 and 29 “pips”. At the peaks and valleys in the curve, you can visually see the candlesticks expanding in size, evidence of activity strength. At the same time, notice how the Bollinger Bands are quickly expanding like a balloon, a confirming signal that a breakout or breakdown in prices is beginning to happen.
If low values persist for some time, the market is consolidating, and a breakout may be in order. As a rule, markets tend to range for 70% of the time, and another rule states that the longer prices are stuck in a range, the larger the breakout will be. In this example, the first quarter of the chart includes an uptrend, followed quickly by a breakdown. As can be observed, the ATR does not always provide perfect signals. No indicator does, and if a trend is gradual, then an ATR reading may be flat.
Let the ATR be your guide as to when shifts are about to occur and seek confirmation from other sources. Practice observing how the ATR reacts with Bollinger Bands and with an RSI. Veterans swear by their practice routines as the best way to engrain their strategy and keep emotions from undermining trading strategy.
How to use the ATR Indicator in forex trading
The critical reference points are high and low points or extended periods of low values. The ATR rollercoaster tends to work better when employing longer timeframes, i.e., daily, but shorter periods can be accommodated, as shown here in this 15-Minute example. The ATR attempts to convey pricing volatility, not pricing direction. It is traditionally used in tandem with another trend or momentum indicator to set stops and optimal entry point margins.
Traders have designed several trading strategies using the ATR. The primary one uses the ATR to indicate potential entry points in the market. For this purpose, the flat periods of an ATR are of significance. The above chart has three such periods, each preceding a significant move in price direction. In other cases, traders place a trailing stop 2 to 3 multiples of the ATR below the highest closing price in the time period selected. This method can lock in gains for you when the market is trending with momentum but suddenly reverses.
Many beginners tend to set stop-loss orders using a fixed amount like 20 or 25 pips below their entry point. When market volatility accelerates, these stop-loss orders are easily stopped out, depriving the beginner of riding the trend. In volatile markets, a better practice is to make the gap for a stop-loss order a fixed percentage of the ATR. In this way, your protection adjusts automatically to the volatility on hand.
As with any technical indicator, an ATR chart will never be 100% correct. False signals can occur due to the lagging quality of moving averages or the nature of the calculations performed. The ATR declined in the first quarter of the chart shown above while prices headed north. This condition usually follows a period of high volatility as the market cools down.
This limitation is evident at specific times of the market. Avoid following the ATR near openings or when major banking centres come on stream in forex. These early periods are typically very volatile until the market finds its equilibrium. Key events, such as when a central bank announces changes in interest rate policy or when important economic data is released, are also to be avoided.
Related Articles
A simple ATR Indicator trading strategy
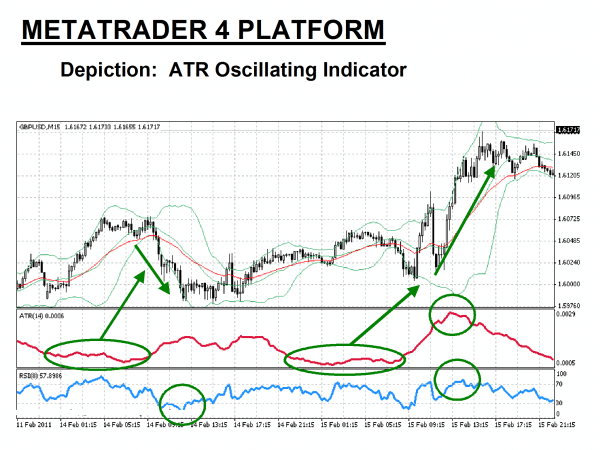
The following trading system is for educational purposes only. In the chart presented below, additional annotations have been added to our previous example, along with the addition of an RSI indicator below the ATR. The “Green” circles on the chart illustrate optimal entry and exit points, and the “Green” ovals indicate a breakout or reversal is imminent using ATR analysis in combination with the RSI “Blue” indicator line.
A simple trading system would then be:
- Determine your entry point when the “Blue” RSI line dips below the “30” lower limit line and add 25 “pips” (“1.5X” the ATR value shown).
- Execute a “Buy Limit” order for no more than 2% to 3% of your account.
- Place a stop-loss order at 25 “pips” (“1.5X” the ATR value shown) below your entry point.
- Determine your exit point when the RSI crosses the “70” upper limit line and is accompanied by a declining ATR value from a previous peak.
Steps “2” and “3” represent prudent risk and money management principles. This simple trading system would have yielded a profitable trade of 100 pips but do remember that the past is no guarantee for how this strategy might perform in the future. However, consistency is your objective, and hopefully, over time, using an ATR will help you tilt the odds in your favour.
The Best Forex Demo Accounts
To master a new trading strategy – such as the ATR strategy we outlined above – you need to practice it. Reading the signals the indicator is giving you and timing your entry and exit points correctly are skills that need to be mastered in order to maximise your profits. This is where a forex demo account comes in: It allows you to practice your new strategy without risking any of your hard-won capital. Below we have picked out some of our favourite forex demo accounts
| Broker | Features | Regulator | Platforms | Next Step | |
|---|---|---|---|---|---|
 Your capital is at risk
Founded: 2014 Your capital is at risk
Founded: 2014 |
|
FSPR | MT4 | ||
 Your capital is at risk
Founded: 2006 Your capital is at risk
Founded: 2006Europe* CFDs ar... |
|
ASIC, FSA, FSB, MiFID | MetaTrader4, Sirix, AvaOptions, AvaTrader, Mirror Trader | ||
|
Between 74-89 % of retail investor accounts lose money when trading CFDs |
|
ASIC, FCA | MetaTrader 4, MetaTrader 5, cTrader | ||
|
|
|
CySEC, FSC, FSCA, MISA | MT4, MT5, OctaTrader | ||
|
|
|
ASIC, CySEC, IFSC | MT4 Terminal, MT4 for Mac, Web Trader, iPhone/iPad Trader, Droid Trader, Mobile Trader, MT5 | ||
 Your capital is at risk
Founded: 2006 Your capital is at risk
Founded: 2006 |
|
CySEC, DFSA, FCA, FSB, SIA | MetaTrader4, MetaTrader5, cTrader, FxPro Edge (Beta) | ||
Example ATR Indicator strategy trades
Let’s look at a real-time trading situation in the forex market to illustrate an ATR indicator forex trading example.
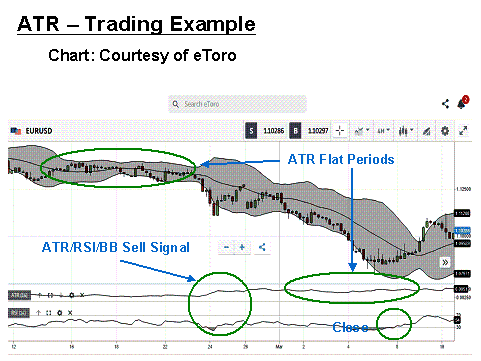
Here we have the “EUR/USD” currency pair plotted on a 4-Hour chart configuration. The ATR is the first indicator at the bottom of the chart, and the RSI is the second. Bollinger Bands have also been added for further complementary support. Notice the extended flat period of prices as they range in the first half of the chart. When you look at the ATR for the same period, it, too, is flat. When the ATR suddenly rises in the first Green circle, it signals that a significant change is imminent.
It would be difficult to catch the first price drop with any certainty, but the ATR has given its signal, the RSI did not rise and stay above its mid-line, and the Bollinger Bands are decidedly sloping downward. It is time to short the Euro. Eventually, the ATR flattens once more. The objective here is to reap a profit before the next shift. Prices have flattened along with the ATR, but when the RSI exits oversold territory, it is time to close the position for a gain of 400 pips.
Concluding Remarks
The Average True Range indicator is a powerful tool for signalling the onset of either a breakout or a breakdown in market prices for a chosen asset. Many veteran traders swear by its attributes. When they have coupled it with a few other indicators, the ‘dance” can be remarkable in generating a host of profitable trading opportunities. All that is required is practice, patience, a step-by-step trading plan, and the will to succeed. The ATR and its other technical support crew can produce a formidable team worthy of any battle in any financial market arena.
Continue Learning
- More Forex Indicators Explained
- RSI Indicator Explained
- Demarker Indicator Explained
- Simple Moving Average Strategy
- Stochastics Indicator Explained

Forextraders' Broker of the Month
BlackBull Markets is a reliable and well-respected trading platform that provides its customers with high-quality access to a wide range of asset groups. The broker is headquartered in New Zealand which explains why it has flown under the radar for a few years but it is a great broker that is now building a global following. The BlackBull Markets site is intuitive and easy to use, making it an ideal choice for beginners.