
Introduction
Many traders agree that the key to success in forex trading is to put together a suite of technical indicators that help monitor what is going on in the markets and identify trends that you need to act on. The Stochastics indicator is one such tool, often used in conjunction with other indicators to help confirm price behaviour in the forex markets.
The Stochastics indicator is a popular member of the oscillator family of technical indicators that essentially attempts to track and forecast overall price trends. It was created by George Lane, who observed that as markets reach a peak, the closing prices tend to approach the daily highs and vice versa. The Stochastics indicator is considered a leading indicator as it aims to generate signals before they appear in pricing behaviour. The indicator can be used in any market, including the forex market, and is commonly used by traders aiming to identify overbought and oversold conditions, indicating the beginnings and endings of cycles in the forex market.
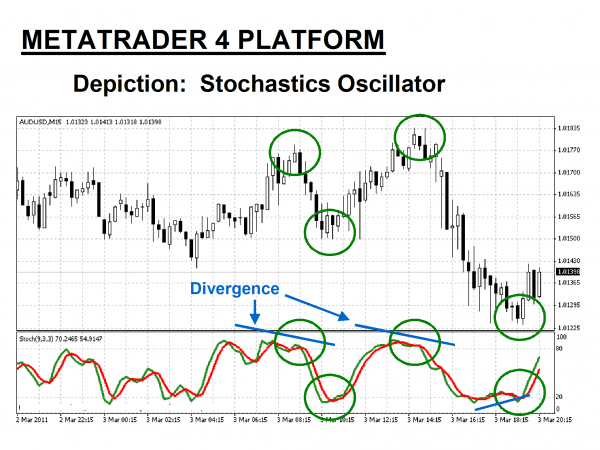
The Stochastics indicator attempts to convey pricing momentum direction changes. Typical oversold and overbought conditions are noted on the chart, and line crossings confirm these trading signals. Divergences are also important as they can indicate that prices are reaching new highs, but the Stochastics lines are already receding from previous highs, which can be seen as a sign to sell or short.
In this article, we will examine how the indicator works, how it is calculated, and how it can be used to identify opportunities in forex trading. We will look at Stochastics indicator forex strategies and suggest examples of how exactly the indicator might create a buy or sell signal, given a particular set of market circumstances.
How is the Stochastics indicator calculated?
It’s important to remember that the Stochastics indicator presents the location of the closing price of a stock in relation to the high and low range of the price of a stock over a period of time, which is typically 14 days but can be customised to other timeframes. The indicator’s inventor, George Lane, has made it clear that Stochastics is not designed to follow price or volume, but rather to track the speed or momentum of price movements.
To understand how this indicator works, we can look at exactly how the calculations are made. Stochastics consist of two lines formed by “%K” and “%D”, which are analysed by the indicator to identify overall trends. The Stochastics indicator uses a calculation formula sequence that involves these steps:
- Choose a period “N” for “%K”, “X” for %D (Standard settings = 9,3)
- %K = 100 * (CCL – LN)/(HN – LN) where CCL = current closing price, LN = lowest low of past “N” periods, HN = highest high of past “N” periods
- %D = 100 * (HX /LX) where HX = X-period sum of (CCL – LN), LX = X-period sum of (HN – LN)
In simple terms, the Stochastic indicator is calculated by subtracting the low for the period from the current closing price, dividing by the total range for the period and multiplying by 100. Be aware that:
- CCL = current closing price
- LN = lowest low of past “N” periods
- HN = highest high of past “N” periods
The trader chooses the period, based on the type of trading being done and the period of time that needs to be studied. Once you have added the necessary data, software algorithms perform the computational work and produce a Stochastics indicator which is displayed on a chart.
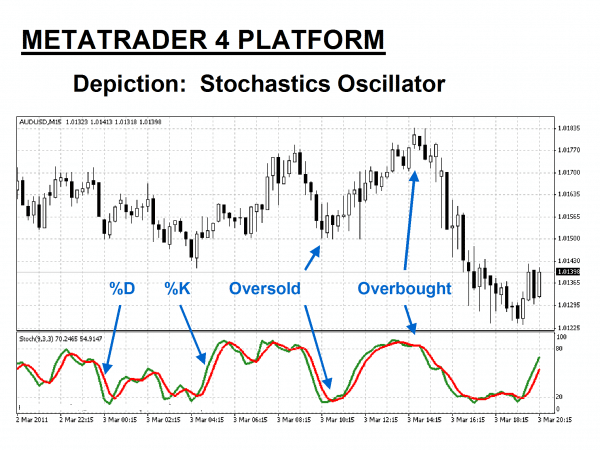
The Stochastics indicator is composed of two fluctuating curves – the “Green” %K line, and the “Red” %D signal line. Forex traders prefer a slower version of this indicator because they believe the signals are more accurate. For Slow Stochastics, %K becomes the old %D line, and the new %D is derived from the new %K.
How to use the Stochastics indicator in forex trading
The stochastic indicator might seem complex, but it is actually a very user-friendly indicator. It is included in most charting and technical analysis programs and can be accessed through the commonly used MT4 forex trading platform.
The standard time period used with the Stochastics forex indicator is 14 days, but this can be customised to meet the needs of individual traders, who might wish to study a much shorter, or longer period. By comparing the current price to the range over time, the stochastics indicator analyses how consistently the closing price is close to a recent high or low price. This helps traders determine if a position is overbought or oversold.
As we have already discussed, the process involves subtracting the low for the period from the current closing price, dividing by the total range for the period and multiplying by 100. For example, if the 14-day high is $150, the low is $125 and the current close is $145, then the reading for the current session would be:
(145-125) / (150 – 125) x 100 = 80
Forex traders focus on the Stochastics key points of reference, which include high points, low points, divergences and sometimes crossovers, looking for buy and sell signals, and often confirming them with other technical indicators before acting. As with most technical analyses, skill in interpreting and understanding Stochastics indicator signals only comes with experience and must be developed over time.
When using the Stochastics forex indicator, it is important to remember that, as with any technical indicator, a Stochastics chart will never be 100% correct in the signals that it presents. Technical indicators are not infallible. Depending on market conditions, indicators will sometimes present traders with false signals. Over time, however, the signals are usually consistent enough to give a forex trader an edge, when it comes to making profitable trades.
Related Articles
A simple Stochastics indicator trading strategy
While every trader will develop their own Stochastics indicator forex trading strategy based on their trading objectives, there are a few things to keep in mind. Some key factors to keep in mind when developing a strategy to use the indicator to identify trades include knowing when to enter a trade and when to exit it, and where to place stop losses. If you are day trading, you might like to use (or adapt) the following strategy.
- Check the daily chart and make sure the Stochastic indicator is below the 20 line and the %K line crossed above the %D line
- Using a 15-minute time frame, wait for the Stochastic indicator to hit the 20 level, with the %K line crossing above the %D line
- Wait for the Stochastic %K line to cross above the 20 level
- Wait for a swing low pattern to develop on the 15-minute Chart
- Enter a long position when the highest point of the swing low pattern is broken to the upside
- Place a stop loss below the most recent 15-minute swing low
Remember that each trader will have their own trading objectives. The Stochastics indicator can be used in both long and short-term trading and adapted to a wide range of situations and market conditions.
The Best Forex Demo Accounts
To master the Alligator trading strategy it is important that you practice it. Reading the signals the indicator correctly timing your entry and exit points are skills that need to be mastered in order to maximise your profits. This is where a forex demo account comes in: It allows you to practice your new strategy without risking any of your hard-won capital. Below we have picked out some of our favourite forex demo accounts to help you out.
| Broker | Features | Regulator | Platforms | Next Step | |
|---|---|---|---|---|---|
 Your capital is at risk
Founded: 2014 Your capital is at risk
Founded: 2014 |
|
FSPR | MT4 | ||
 Your capital is at risk
Founded: 2006 Your capital is at risk
Founded: 2006Europe* CFDs ar... |
|
ASIC, FSA, FSB, MiFID | MetaTrader4, Sirix, AvaOptions, AvaTrader, Mirror Trader | ||
|
Between 74-89 % of retail investor accounts lose money when trading CFDs |
|
ASIC, FCA | MetaTrader 4, MetaTrader 5, cTrader | ||
|
|
|
CySEC, FSC, FSCA, MISA | MT4, MT5, OctaTrader | ||
|
|
|
ASIC, CySEC, IFSC | MT4 Terminal, MT4 for Mac, Web Trader, iPhone/iPad Trader, Droid Trader, Mobile Trader, MT5 | ||
 Your capital is at risk
Founded: 2006 Your capital is at risk
Founded: 2006 |
|
CySEC, DFSA, FCA, FSB, SIA | MetaTrader4, MetaTrader5, cTrader, FxPro Edge (Beta) | ||
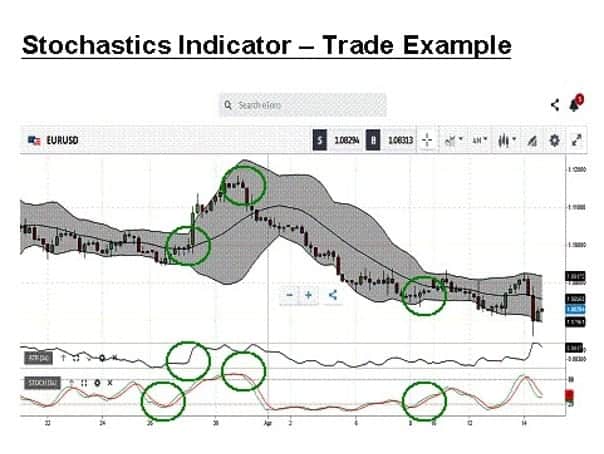
Example Stochastics indicator strategy trades
There are a few different ways to use the Stochastics indicator and incorporate it into your trading strategies. Firstly, you can use the Stochastic indicator to try and predict market turning points. This is the most common way to find those overbought or oversold conditions that happen at the beginning and end of market cycles. To do this, you can combine the Stochastics indicator with a Simple Moving Average (SMA) indicator.
- When the price of an asset is above the 200-period moving average, then look for long setups when Stochastic is oversold
- If the price is below the 200-period moving average, then look for short setups when Stochastic is overbought
Adding the SMA can be more helpful than just relying on Stochastics, because the market can of course remain overbought, or oversold for quite some time. Combining indicators can help to identify actual turning points.
You can also use the Stochastic indicator to better time your entry points when it comes to trading forex or other assets. The Stochastic indicator can deliver a very clear point of entry to a trade, which can still be adapted to the type of trader you are and what you want to achieve.
Using Stochastic to watch for signals to enter a trade can be as simple as:
- Going long when the Stochastic line crosses above 20
- Going short when the Stochastic line crosses below 80
As with any indicator, you can use other forms of analysis to confirm or experiment by simply using the Stochastic line crossovers as straightforward buy and sell signals.
When devising a Stochastic indicator trading strategy, it is important to understand that the indicator does have limitations, as all trading tools and indicators do. The main limitation of the Stochastic indicator is that it can produce false signals. A false signal is exactly what it sounds like. It is a trading signal generated by the indicator that turns out to be inaccurate. Just because the Stochastic indicator is a leading indicator does not mean it is predictive as such. Sometimes the indicator suggests a certain price behaviour is imminent, but the price does not follow through. Traders who act on a false signal can obviously end up making an unprofitable trade.
During volatile market conditions, where there are lots of price changes and quick reversals, this can happen quite regularly, resulting in several losing trades if acted upon. One way to avoid acting on false signals from the Stochastics indicator is to use the price trend as a filter, and only act on buying and selling signals if they are in the same direction as the trend.
Conclusion
For forex traders interested in technical analysis, the Stochastics indicator is a tool worth exploring. It is a convenient way to identify trends and monitor the speed or momentum of price movements, although, as its inventor has pointed out, it is not designed to follow price or volume as such. As a leading indicator, many traders will use it to try and forecast future price movements, although it should always be remembered that no technical indicator or trading chart can perfectly predict future price trends.
The Stochastics indicator is useful and versatile, allowing everyone from day traders to long-term investors to use the timeframes that suit them, whether trying to establish price momentum over minutes or weeks. As with any indicator, traders should be aware of how easy it is for a tool such as this to present false, and potentially unprofitable, buy and sell signals, especially during periods of high market volatility. The Stochastics indicator, like any trading tool, has both pros and cons, but it can certainly give traders an edge, and its versatility and simplicity make it popular among a wide range of traders.
When using the Stochastics indicator, it is helpful to determine in advance what your trading strategy will be, including factors such as how much you will invest when a buy signal is triggered, and at what point you will exit a position or place a stop-loss order, to ensure you do not lose too much money. This is particularly important if you have indeed acted on a false signal and the price movements you are expecting are not happening.
Always keep in mind that the Stochastics indicator is simply a useful tool and that there are no guarantees in trading, even when employing careful technical analysis. The most experienced and dedicated traders will tend to use the Stochastics indicator alongside other technical indicators, such as a simple moving average, or an RSI, and will in addition combine their technical analysis with fundamental analysis as well. The forex markets can be very volatile, so the more information on the market that can be factored into your trading decisions, the better.
Continue Learning
- More Forex Indicators Explained
- RSI Indicator Explained
- ATR Indicator Explained
- Williams Percent Range Strategy
- Parabolic SAR Strategy

Forextraders' Broker of the Month
BlackBull Markets is a reliable and well-respected trading platform that provides its customers with high-quality access to a wide range of asset groups. The broker is headquartered in New Zealand which explains why it has flown under the radar for a few years but it is a great broker that is now building a global following. The BlackBull Markets site is intuitive and easy to use, making it an ideal choice for beginners.