- Introduction
- How is the Williams Percent Range Indicator calculated?
- How to use the Williams Percent Range Indicator in forex trading
- Related Articles
- A simple Williams Percent Range trading strategy
- The Best Forex Demo Accounts
- Example of a Williams Percent Range strategy trade
- Concluding Remarks
- Continue Learning
Introduction
The “Williams Percent Range” or “%R” indicator is a popular member of the Oscillator family of technical indicators. Larry Williams created the %R oscillator along the same lines as the Stochastics indicator, but without its smoothing component and with a reversed scale. The Williams Percent Range indicator is uncanny in its ability to signal a reversal one or two periods ahead of reality. Traders use the indicator to determine overbought and oversold conditions and reversals in market trends.
Larry Williams is a legend in his own time. He was born in Miles City, Montana, in 1942 and is still surviving to this day. From his obscure small-town heritage, Williams secured a degree in journalism and became a successful author and trader in stocks and commodities. Writing over 11 books to date, mainly in the trading genre, he also found the time to develop several technical indicators in use today. The Williams Percent Range bears his name.
He is also known for winning the 1987 World Cup Championship of Futures Trading by turning $10,000 into $1.1 million over just 12 months. Several of his books catalogue his strategies and his trading prowess. Like many other traders and analysts of the age, he was intent on using the power of the computer to provide accurate signals for when price momentum was about to increase or begin to fade. The Williams %R was the result of his analysis, but he also contributed the Ultimate Oscillator and several studies on commodity cycles, investor sentiment, and accumulation/distribution indicators.
The Williams Percent Range indicator is classified as an oscillator since its values fluctuate between zero and “-100”. How this indicator is calculated leads to the negative value scale. The indicator chart typically has lines drawn at the “-20” and “-80” values as warning signals. Values between “-80” and “-100” are interpreted as a strong oversold condition, or “selling” signal, and between “-20” and “0.0”, as a strong overbought condition, or “buying” signal. A few publishers reversed the scale to yield a positive 100 value, so be wary of this error.
These signals, however, can also alert the trader to other potential changes in price direction. Even Williams did not accept these basic overbought and oversold interpretations as absolute truth. He preached following a series of signals instead of just a single one. On a daily scale, he would let a few days pass, and if the indicator reversed more than 10% to 15%, he might react with the appropriate order.
No indicator is perfect, but the proper use of them can always provide an edge, and that edge is all that is required for a trader to be successful over time. The Williams Percent Range indicator has its strengths and weaknesses, and the only way to discern either is by gaining experience with its use. Practice sessions on a demo system are the only shortcut for achieving this experience.
Experiment in virtual mode until you become familiar with the nuances of this oscillator and combine its use with one or two other indicators to provide additional insights and confirmations of the trading setups that you uncover. While practising, develop a step-by-step William Percent Range strategy and fine-tune it until you are comfortable enough to try it out in real-time with real capital. Confidence and patience are the name of the game, and this trading strategy will help you keep your emotions in check, the advice every veteran will give you when asked.
How is the Williams Percent Range Indicator calculated?
The Williams Percent Range indicator is common on MetaTrader4 trading software and proprietary systems. The calculation formula sequence follows a set of steps that resemble those for a Stochastics indicator. The %R uses the “Highest High” for the period selected, whereas Stochastics reverses the process using the “Lowest Low” for the same period. Here are the %R steps:
- Choose a period “N” for “%R” (Standard is “14”).
- %R = 100 * (HN – CCP)/(HN – LN) where CCP = Current Closing Price, LN = lowest low of past “N” periods, HN = highest high of past “N” periods.
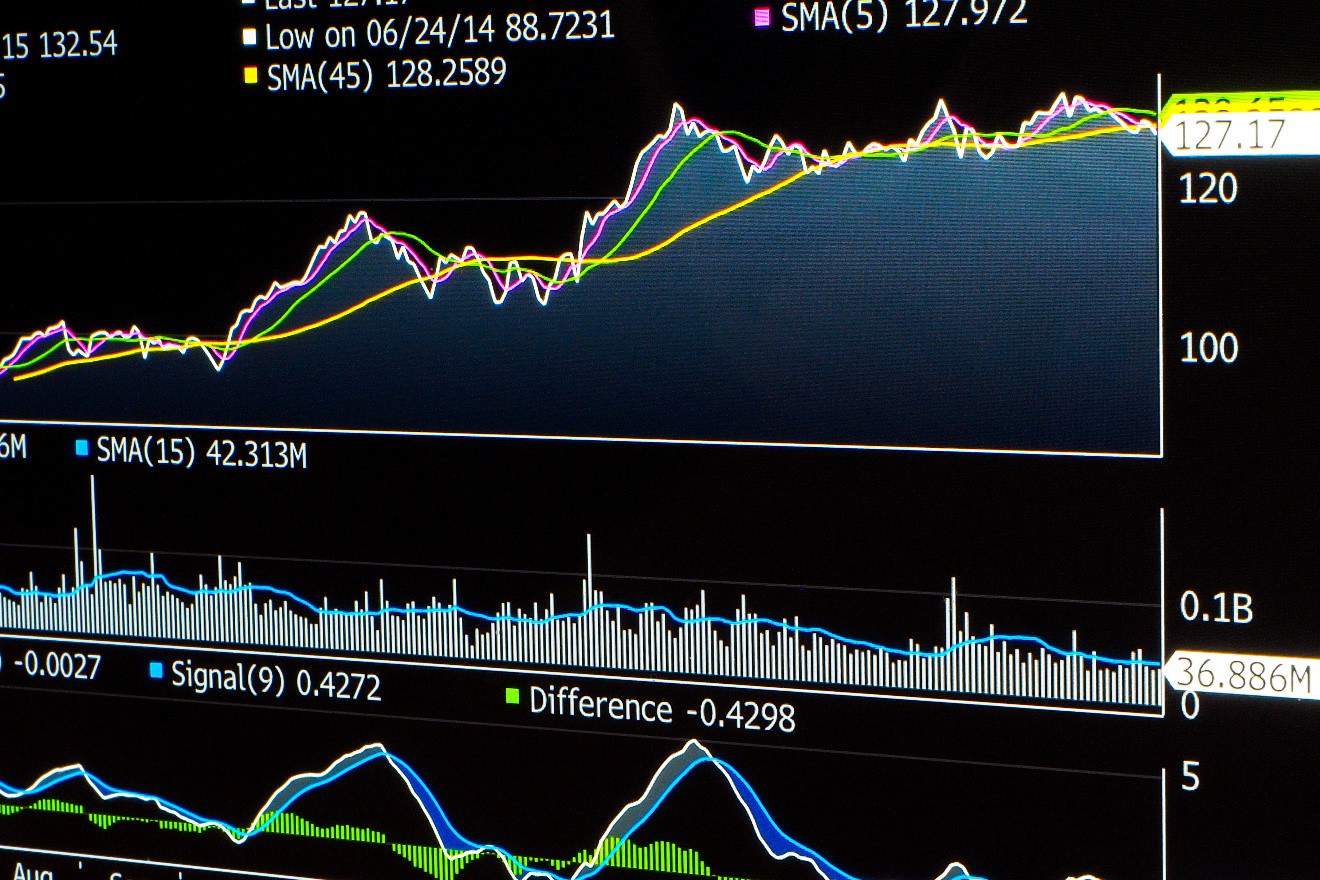
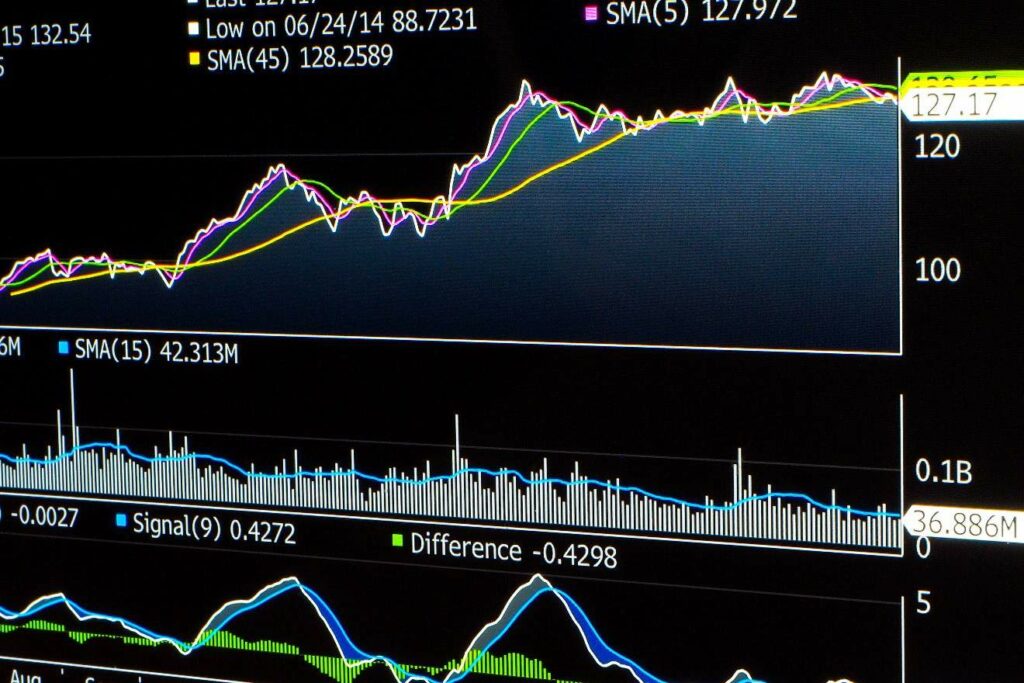
The beauty of today’s modern trading platforms like MT4 is that software programs perform the necessary calculations instantaneously to produce a Williams Percent Range indicator, as presented in the diagram in the introduction. The indicator is located at the bottom of the chart with its “0 to -100” scale depicted on the right.
The Williams Percent Range indicator is composed of a single fluctuating curve. Traders will occasionally add a Smoothed Moving Average, as above in “Red”, to enhance the value of the trading signals. In the example above, the “Purple” line is the Williams Percent Range, while the “Red” line represents an “SMA” for “14” periods.
The Williams Percent Range is viewed as a “leading” indicator in that its signals foretell that a change in trend is imminent. The weakness in the indicator is that timing is not necessarily a product of the %R oscillator, the reason for attaching a “lagging” moving average to confirm the Williams Percent Range signal. Forex traders favour the Williams Percent Range indicator because of its ability to foretell reversals one to two periods ahead of time.
As with any oscillator, one should wait until actual pricing behaviour confirms the reversal. Beginners often make the mistake of trying to guess peaks and valleys for price swings. However, the sage advice from Williams and other trading veterans is to wait until confirmation from prices or insights gleaned from other technical indicators or recognizable patterns. Once again, your practice sessions are the best avenue for learning the nuances of the Williams %R indicator.
How to use the Williams Percent Range Indicator in forex trading
From its method of calculation, it can be discerned that the %R is always comparing the current price to the highest closing price for the chosen period, typically, “14”. You may experiment with other time periods, too. Williams spoke to “10” as a sensitive number to use, but shorter periods tend to create more false signals.
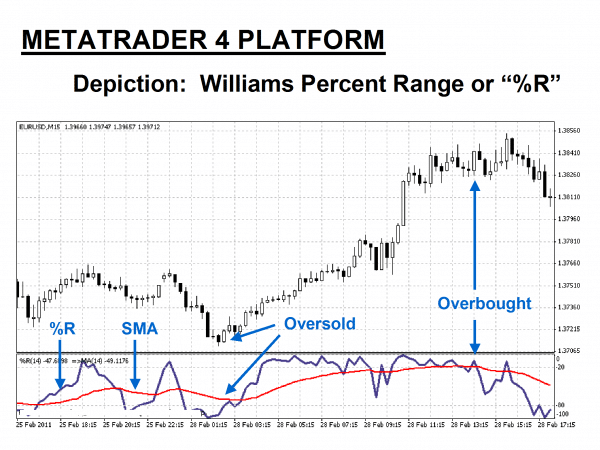
Let’s take another look at our introductory chart with slightly different annotations:
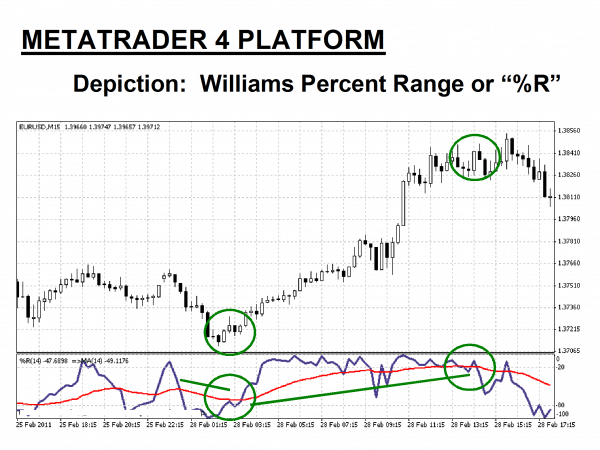
In this chart, the Williams Percent Range oscillator has a setting of “14” and is presented on the bottom portion of the above “15 Minute” chart for the “EUR/USD” currency pair. In the example above, the “Purple” line tracks the values of the Williams %R, while the “Red” line represents a smoothed moving average, added for trade signal confirmation. Williams Percent Range values above “-20” and below “-80” are worthy of attention, as noted by the “Green” circles.
The key points of reference are high and low. The Williams Percent Range rollercoaster tends to be more sensitive than other oscillators and is favoured by many forex traders for that reason. This oscillator attempts to convey pricing momentum direction changes. Typical oversold and overbought conditions are borne out by Green circles, and line crossings, provided by the additional SMA, help to confirm these trading signals.
If we look at the first set of Green circles, the R% dipped below the “-80” line before prices reversed to form a new uptrend. During the uptrend, the R% rose toward zero, crossed over the “-20” line, and hovered there, indicating strong momentum. Yes, there was a minor dip below a “-50” mid-line, but the benefit of the Red SMA is that its slope remained upward, a sign that the trend had not peaked. If the position had been closed once the SMA flattened and the R% went into decline, a healthy gain of 100 pips would have been recorded.
This example illustrates a particular trait of the R% indicator – overbought conditions do not necessarily mean that a sell signal is in order, nor does an oversold signal mean that it is time to buy. As seen in the example, the R% rose above “-20” and then hovered there during the uptrend. There is also a point to be made about the “-50” mid-line – Prices forcefully crossed this mid-line at the beginning of the trend and continued to the “-20” threshold. The trend concluded after the R% forcefully crossed the mid-line again, but this time, it headed directly to the “-80” territory.
One of the most challenging decisions to make in trading is to know when to close a winning position. The R% does provide a means for holding on while your winner runs its course. Beginners tend to sell their winners too early. The R%, however, is not perfect. It does have limitations. Every overbought and oversold signal may not be a harbinger of a reversal. Care must be taken by reading other complementary signals, whether from an SMA or some other indicator or chart pattern, as a combined way of knowing how to proceed. False signals occur. Be wary of them.
Related Articles
A simple Williams Percent Range trading strategy
What is Williams Percent Range from a trading strategy perspective? The following trading system is for educational purposes only, but let’s review the previous chart once more:
The “Green” circles on the above chart illustrate optimal entry and exit points for a trading strategy using Williams Percent Range analysis in combination with the additional smoothed moving average – Note the reversing slope patterns of the SMA as confirmation points for the %R trading signals when generated.
A simple trading system would then be:
- Determine your entry point after the “Purple” %R line crosses the lower extreme value and after the “Red” line SMA flattens before changing direction.
- Execute a “Buy” order for no more than 2% to 3% of your account.
- Place a stop-loss order at 20 “pips” above your entry point.
- Determine your exit point after the “Purple” %R line rises above an extreme upper value, and after the “Red” line SMA flattens before changing direction.
Steps “2” and “3” represent prudent risk and money management principles that should be followed. This simple trading system would have yielded one profitable trade totalling 120 “pips”, but do not forget that the past is no guarantee of where future prices might head. However, consistency is your objective, and hopefully, over time, a Williams Percent Range trading strategy will provide you with the edge you need to succeed.
The Best Forex Demo Accounts
To master a new trading strategy – such as the Williams %R strategy we outlined above – you need to practice it. Reading the signals the indicator is giving you and timing your entry and exit points correctly are skills that need to be mastered in order to maximise your profits. This is where a forex demo account comes in: It allows you to practice your new strategy without risking any of your hard-won capital. Below we have picked out some of our favourite forex demo accounts
| Broker | Features | Regulator | Platforms | Next Step | |
|---|---|---|---|---|---|
 Your capital is at risk
Founded: 2014 Your capital is at risk
Founded: 2014 |
|
FSPR | MT4 | ||
 Your capital is at risk
Founded: 2006 Your capital is at risk
Founded: 2006Europe* CFDs ar... |
|
ASIC, FSA, FSB, MiFID | MetaTrader4, Sirix, AvaOptions, AvaTrader, Mirror Trader | ||
|
Between 74-89 % of retail investor accounts lose money when trading CFDs |
|
ASIC, FCA | MetaTrader 4, MetaTrader 5, cTrader | ||
|
|
|
CySEC, FSC, FSCA, MISA | MT4, MT5, OctaTrader | ||
|
|
|
ASIC, CySEC, IFSC | MT4 Terminal, MT4 for Mac, Web Trader, iPhone/iPad Trader, Droid Trader, Mobile Trader, MT5 | ||
 Your capital is at risk
Founded: 2006 Your capital is at risk
Founded: 2006 |
|
CySEC, DFSA, FCA, FSB, SIA | MetaTrader4, MetaTrader5, cTrader, FxPro Edge (Beta) | ||
Example of a Williams Percent Range strategy trade
Let’s shift gears and look at a real-time trading example from a different perspective. There are many ways to use the R% indicator. Enjoy discovering the usefulness of this tool on your demo system, and then employ it in a real-time setting for consistent gains.
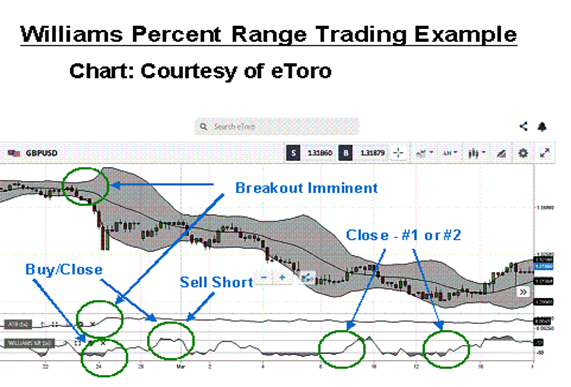
We have paired the R% indicator with the Average True Range (ATR) indicator and Bollinger Bands (BB) in this example. The “GBP/USD” currency pair is plotted on a “4-Hour” timeline, and a serious downtrend has developed. A sudden increase in an ATR’s value is an alert that ranging price behaviour is about to change. The same is true for BBs. They contract during ranging periods and expand suddenly when a shift is about to occur.
An aggressive trader might buy after the accompanying Red closing candlestick in the first R% Green circle, then close and sell short upon the reading in the second Green circle. If your risk tolerance is low, you might close for a gain in the third Green circle after the R% decidedly shifted from below “-80” to over “-20”. An aggressive trader might notice that prices did not cross the upper BB limit, delay, and then close during the last Green circle. If you had followed this strategy, your gains could have been between 400 and 500 pips.
Concluding Remarks
Like many other oscillating indicators, the Williams Percent Range is helpful in signalling when a reversal is imminent and how quickly the momentum of a trend is ebbing. Its overbought and oversold alerts do not necessarily signal bearish or bullish trends are in process. Experience gained during your practice sessions will enable you to interpret the R% correctly when used in tandem with other technical techniques. Develop a trading strategy around this powerful tool, test it out on a demo system, and then reap the benefits in real-time.
Continue Learning
- More Forex Indicators
- Alligator Trading Strategy
- MACD Indicator Explained
- Stochastics Indicator Explained

Forextraders' Broker of the Month
BlackBull Markets is a reliable and well-respected trading platform that provides its customers with high-quality access to a wide range of asset groups. The broker is headquartered in New Zealand which explains why it has flown under the radar for a few years but it is a great broker that is now building a global following. The BlackBull Markets site is intuitive and easy to use, making it an ideal choice for beginners.