In order to maximize a reversal trading opportunity, traders must jump on board the trend as near to the reversal point as possible. However, the counsel of veteran traders is to never attempt to guess the exact reversal point. Veterans have the scars from attempting this folly, but you can get close if you use reliable candlestick reversal patterns in combination with your favourite technical indicator. One such candlestick signal in forex is known as the ‘bearish kicking pattern’.
Source: Tradingview.com
Candlesticks are the most popular charting mechanism on today’s modern trading platforms. They immediately convey to a trader a simple visual representation of how prices are changing in a dynamic marketplace. These curious little shapes made their appearance when a famous Japanese trader introduced them in the 1700s to traders in the burgeoning rice futures markets. They are a recent phenomenon in the West, having only gained widespread popularity in the past 30 years or so.
The benefits of these shapes do not stop at their visual representation of events. Books have been written on how a single candle or a small grouping can signify major reversals in pricing behaviour to provide an insight into the continuation of a previous trend. There are bearish candlestick patterns as well as bullish ones, and a few also indicate indecision in the minds of investors. Several of these patterns are easy to comprehend, while others can be complex. However, when combined with other elements, they can become a formidable tool in the trader’s toolbox.
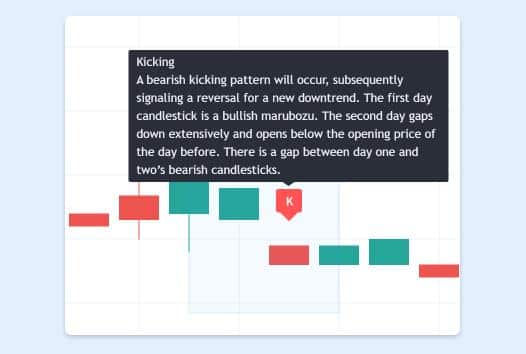
The bearish kicking candlestick pattern, as depicted in the above graphic, involves two individual candles. One is an uptrend or green in colour, while its companion must be a downtrend or coloured red. The ‘gap’ in pricing provides the ‘kick’, which is where it gets its name. The first candle must also be a Marubozu (Japanese for a ‘shaved head’). Its body will have little to no wicks to be seen. The pattern is rare in forex markets and much more prevalent in stock markets, where sessions close each day. When it does occur, it is a strong reversal signal.
Traders would be wise to have a basic understanding of candlestick patterns and trading techniques that emanate from them. More experienced traders are well aware of the many implications of these patterns and may shift market action abruptly at the first sign of one of these groupings. Having an edge in the forex market is crucial for success, and candlesticks can easily become another weapon in your arsenal with a small investment of time.
In this article, we will touch upon just one trading strategy involving candlesticks: the bearish kicking candlestick pattern. In this article, you will learn more about this pattern, what it means from a market psychology perspective, and how to incorporate a bearish kicking strategy in your daily trading agenda. Lastly, we will provide a recommendation of the best forex brokers to use when deploying this candlestick strategy.
What Is the Bearish Kicking Candlestick Forex Pattern?
The intro graphic depicted above is for an ideal situation for a bearish kicking pattern, but this ideal depiction is very rare in the forex world, as trading occurs 24 hours a day, five and a half days a week. There is, however, more than one definition for a Marubozu. The ‘full’ variety has no wicks, while an ‘open’ or ‘close’ Marubozu has a small wick on one end, either the open or closing position.
Even with these clarifications, two modified Marubozus in succession are still a rare event, but when it does happen, it is a very strong reversal signal, which institutional traders will not ignore. The bearish kicking pattern happens when this pair of Marubozus occurs at the end of an uptrend. The first candle is green, and the second one is red, with a noticeable gap between the bodies of the two shapes. Let’s look at a four-hour chart of the popular EUR/USD pair:
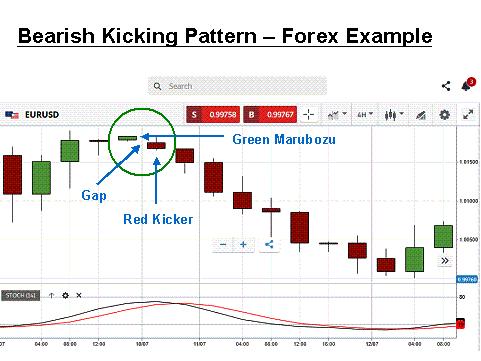
Source: eToro
This chart is courtesy of eToro, and the annotations highlight the basic components embodied in the bearish kicking pattern. The bullish Marubozu follows an uptrend, but its body size denotes a weakening of momentum. The bearish Marubozu closes sharply downward as its entire body gaps below the previous period’s opening price. This second candle is what kick-starts the strong decline over the next eight trading periods.
As you might expect, there is also a bullish kicking pattern, which signals the reversal of a downtrend, but this topic is covered elsewhere. The major takeaway is that professional traders recognize this rare pattern instantly and waste no time trading it to their advantage. The shift in momentum can be sudden, but it also helps to have additional confirmation before reacting.
What Does the Bearish Kicking Candlestick Forex Pattern Mean?
Candlestick formations instantly convey the psychology of the market at a given moment. From a single candle to a series of two to three of them, interpretations have been proffered of what is going on in the mind of the market. In fact, the inventor of candlesticks, Honma Munehisa, actually published his treatise on market psychology as long ago as 1755.
As noted above, the bearish kicking pattern consists of two candles. The first candle by itself is not significant when observed in an uptrend, but when it is combined with a gapping down bearish candlestick, it is a powerful signal, one that is rare and not often seen. As for the first Marubozu, the size of the body can be deceiving. It could on its own signify that an upwardly moving trend will continue. A smaller version, as noted in the above graphic, is an initial sign of weakness. Sellers have slowed the bulls’ advance. Momentum is waning.
An astute trader will now become a keen observer. What will the next candle communicate? The ‘gap’ is a sure sign that some very large sell orders have been fulfilled. If it were only basic profit taking, then the gap would not arise. The presumption is that institutional traders have jumped on the first Marubozu, thereby creating the bearish candle that leads to more of the same in the following periods.
How to Trade the Bearish Kicking Candlestick Forex Pattern
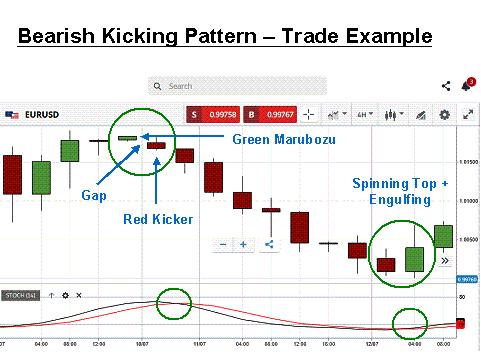
Source: eToro
Let’s take what we have learned and convert it into a viable trading strategy. We will start with the same chart provided by eToro and add a few more annotations. For additional support, we will also use the stochastic indicator at the bottom of the chart to suggest both overbought and oversold conditions in the market for the EUR/USD pair on a four-hour basis. Green Marubozus are more prevalent at shorter timeframes, but volatility and noise can render even the best indicators ineffective.
Are other indicators acceptable? Yes, experiment on your demo system to see if other indicators give better results for you. Some traders foster the use of Bollinger Bands or simple moving averages as a way to have a useful boundary condition on the chart of pricing candles. You may not want another system that is too lagging in its alerts, as traders in the know will react swiftly to these conditions.
When the ‘red kicker’ appears, it could mean that a reversal of an uptrend is imminent or that a previous downtrend will be continued. In either case, the strategy will be to short the market. In this example, the stochastic crossover is confirmation of the bearish kicking pattern. It is time to sell euros versus the US dollar. The placement of your stop loss should be just above the ‘shaved head’ of the green Marubozu.
Eight red candles followed the kicker candle. Closing your position is your choice, but for this example, the appearance of spinning tops reflects indecision in the market. However, the engulfing pattern and the stochastic crossover to the right seal the deal. This trade would have yielded roughly 150 pips, a good return for responding quickly to market conditions.
Conclusion
Immediately recognising candlestick patterns on forex charts can only increase your odds of being successful as a trader. Veterans swear by the immediate insights that these simple little shapes convey about market psychology and the direction that prices might go in the near term. In this article, we have previewed just one of these many trading patterns, the bearish kicking candlestick pattern.
When it occurs, it is a strong reversal signal, one that veterans and professionals will react to instantly. Trying to outthink these pros is never a good idea. It is best to know how they think and how they react to various candlestick signals in the forex market, and then join in with the chorus. Practice finding the kicker in your charts and observing the reactions that follow. Incorporate this trading system into your daily strategy and achieve a new edge in the volatile forex market.
Trade Candlestick Patterns with Top Forex Brokers
| Broker | Features | Regulator | Platforms | Next Step | |
|---|---|---|---|---|---|
 Your capital is at risk
Founded: 2014 Your capital is at risk
Founded: 2014 |
|
FSPR | MT4 | ||
 Your capital is at risk
Founded: 2006 Your capital is at risk
Founded: 2006Europe* CFDs ar... |
|
ASIC, FSA, FSB, MiFID | MetaTrader4, Sirix, AvaOptions, AvaTrader, Mirror Trader | ||
|
Between 74-89 % of retail investor accounts lose money when trading CFDs |
|
ASIC, FCA | MetaTrader 4, MetaTrader 5, cTrader | ||
|
|
|
ASIC, CySEC, IFSC | MT4 Terminal, MT4 for Mac, Web Trader, iPhone/iPad Trader, Droid Trader, Mobile Trader, MT5 | ||
 Your capital is at risk
Founded: 2006 Your capital is at risk
Founded: 2006 |
|
CySEC, DFSA, FCA, FSB, SIA | MetaTrader4, MetaTrader5, cTrader, FxPro Edge (Beta) | ||
|
|
|
CySEC, FSC, FSCA, MISA | MT4, MT5, OctaTrader | ||

Forextraders' Broker of the Month
BlackBull Markets is a reliable and well-respected trading platform that provides its customers with high-quality access to a wide range of asset groups. The broker is headquartered in New Zealand which explains why it has flown under the radar for a few years but it is a great broker that is now building a global following. The BlackBull Markets site is intuitive and easy to use, making it an ideal choice for beginners.