The Australian Dollar/New Zealand Dollar currency pair (also referred to as AUDNZD and AUD/NZD) is considered a minor pair. In this article, we will examine how AUDNZD is performing.
AUDNZD Key Stats
- 2021 high: 1.0947
- 2021 low: 1.0279
- YTD high: 1.1179
- YTD low: 1.0574
- YTD % change: +3.94%
AUDNZD Forecast
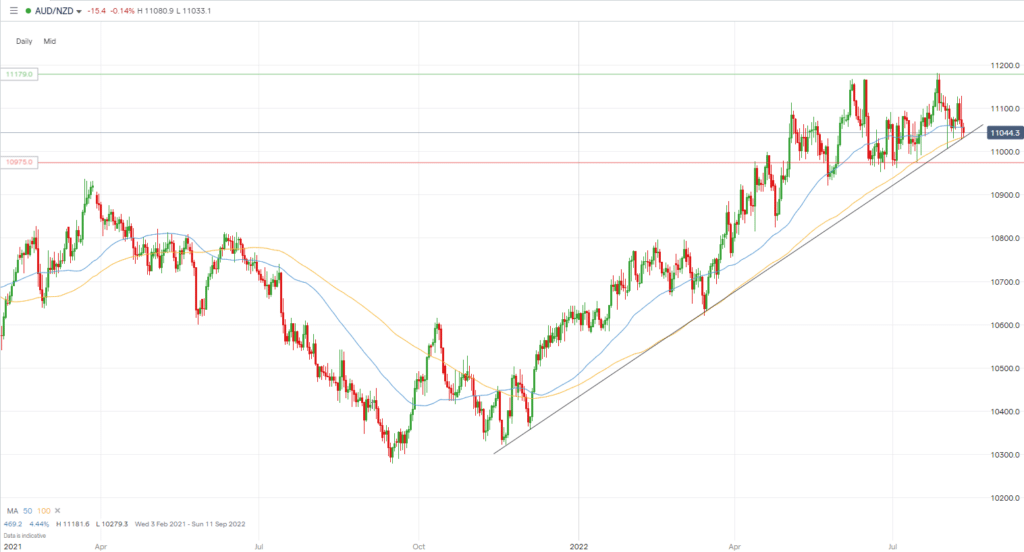
The AUDNZD hit highs not seen since 2018 in late July, and most had expected the run to continue following Australia’s consumer inflation expectations data. It had been expected to move higher but, in fact, came in at 5.9%, below the expectations of 6.2%. It has resulted in a slight downside for the AUDNZD pair, but nothing significant. With price pressures surging in the New Zealand economy, and New Zealand expected to continue rate rises, we see a near-term move to the downside. Especially after the recent run higher. While not significant, the first area we are watching is 1.0975.

AUDNZD Fundamental Analysis
Fundamental analysis is key to major changes in the foreign exchange market. A clear directional bias can be established through fundamental analysis, and major changes in monetary policy or economic activity can impact a currency pair. Technical analysis is also important, but economic health can also be a defining factor.
The Australian Dollar is a frequently traded currency impacted by numerous global macroeconomic factors. A significant driver of the AUD price comes from its wealth of natural resources as well as its trading with Asian countries. India and China have been large importers of Australia’s commodities and hold a strong relationship with Australia. Furthermore, Australia imports heavy machinery and goods produced in those countries. Therefore, the AUD is not only affected by its own economy, but when other economies, such as China, suffer a downturn, it negatively impacts Australian exporters, hurting the supply chain and resulting in a weakening Australian dollar. Therefore, AUD traders must keep up to date with the Australian economy and its trade counterparts.
On the other hand, the New Zealand Dollar is considered a carry trade currency. This is due to it being a relatively high-yielding currency, so investors tend to buy the NZD and fund it with a lower-yielding currency. However, during a period of negative sentiment, this can impact a currency such as the NZD, and this was evident during the financial crisis when high-yielding currencies fell significantly. Meanwhile, other factors to consider include tourism numbers and dairy prices for the NZD. It is one of the biggest exporters of whole milk powder so the economy can benefit from higher milk prices.
Related Articles
- AUDJPY Forecast And Live Chart
- NZDCAD Forecast And Live Chart
- What Are Commodity Forex Pairs?
- What Are Major Forex Pairs
AUDNZD Technical Analysis
Support Levels:
- 1.0975
- 1.0923
- 1.0822
Resistance Levels:
- 1.1135
- 1.1179
- 1.1270
Looking at potential downside areas for the AUDNZD, we see, as mentioned in our forecast, 1.0975 as a potential target. Price is still sitting within its bullish trend, currently above the 100 MA, but we see it moving lower and crossing below in the near future, potentially signalling a sustained downside move. The next level below that to keep an eye on is 1.0923, which has been tested a couple of times in 2022. Furthermore, also keep your eyes on 1.0822 as our longer-term downside target.
Resistance levels for our current stance on the pair represent potentially good entry points for a bearish move. For example, 1.1179 clearly stands out as a strong resistance level. This is the highest price point since 2018, while just below that there is 1.113. In addition, beyond those two, we see 1.1270 as another potential area to watch if the price continues higher.
Trade AUDNZD with our top brokers
| Broker | Features | Regulator | Platforms | Next Step | |
|---|---|---|---|---|---|
 Your capital is at risk
Founded: 2014 Your capital is at risk
Founded: 2014 |
|
FSPR | MT4 | ||
 Your capital is at risk
Founded: 2006 Your capital is at risk
Founded: 2006Europe* CFDs ar... |
|
ASIC, FSA, FSB, MiFID | MetaTrader4, Sirix, AvaOptions, AvaTrader, Mirror Trader | ||
 Between 74-89% of CFD traders lose
Founded: 2010 Between 74-89% of CFD traders lose
Founded: 2010Between 74-89 % of retail investor accounts lose money when trading CFDs |
|
ASIC, FCA | MetaTrader 4, MetaTrader 5, cTrader | ||
 Your capital is at risk
Founded: 2009, 2015, 2017 Your capital is at risk
Founded: 2009, 2015, 2017 |
|
ASIC, CySEC, IFSC | MT4 Terminal, MT4 for Mac, Web Trader, iPhone/iPad Trader, Droid Trader, Mobile Trader, MT5 | ||
 Your capital is at risk
Founded: 2006 Your capital is at risk
Founded: 2006 |
|
CySEC, DFSA, FCA, FSB, SIA | MetaTrader4, MetaTrader5, cTrader, FxPro Edge (Beta) | ||
 Your capital is at risk
Founded: 2011 Your capital is at risk
Founded: 2011 |
|
CySEC, FSC, FSCA, MISA | MT4, MT5, OctaTrader | ||
Forextraders' Broker of the Month
BlackBull Markets is a reliable and well-respected trading platform that provides its customers with high-quality access to a wide range of asset groups. The broker is headquartered in New Zealand which explains why it has flown under the radar for a few years but it is a great broker that is now building a global following. The BlackBull Markets site is intuitive and easy to use, making it an ideal choice for beginners.
