Trying to predict the future price of securities, be it stocks, currencies, options, or commodity futures, is not an easy task. Investors look to fundamental analysis to try and gauge the actual value of a security; however, traders often turn to technical analysis to complement their research and help time their trades better. There are several types of technical indicators: trend, momentum, volume, volatility, and support/resistance. They are used to predict different markets and are each best suited to different circumstances. Few technical indicators are more suitable for predicting and timing volatile markets than the Commodity Channel Index indicator (CCI). In this article, we will take a look at how it is calculated, how to use it in forex trading, and provide a simple CCI indicator trading strategy to help improve your trading arsenal.
How is the CCI Indicator calculated?
CCI calculation is relatively straightforward and involves several short steps. Here is the formula for the CCI indicator:
- CCI = (Typical Price – MA) / (0.015 × Mean Deviation)
We can calculate the values of CCI in a 7-step process:
- Determine the number of periods the CCI indicator will cover and provide a numeric figure. Most trading software takes 20 trading periods as the default setting; however, it can be changed to your liking. More periods will result in a smoother CCI indicator, whereas fewer periods will result in a more volatile CCI. Once you have chosen the number of periods, continue using that number for the remainder of the CCI calculation. For this calculation, we will assume 20 periods as our basis. You will, in total, need to have at least twice the number of periods worth of data to compute CCI indicator values.
- To calculate the CCI indicator, you will need to find High, Low, and Close price data for your security of interest (it is best to paste the data into a spreadsheet with High, Low, and Close prices in separate columns). Once you have the required data, compute the Typical Price by calculating the average of High, Low, and Close prices for each 20 periods.
- Once you have the Typical Price for at least 20 periods, calculate the Moving Average (MA) of the Typical Price totalling the last 20 prices and divide the result by 20.
- Calculate Deviation by subtracting the Moving Average (MA) from the Typical Price for the last 20 periods.
- Calculate the Mean Deviation by summing the last 20 absolute Deviation values (without the – signs) and then divide the result by 20.
- You should, by now, have arrived at the Typical Price, Moving Average (MA), and Mean Deviation values for at least one time period. You can now use the CCI indicator formula to compute CCI values.
- You can repeat the process for any new periods by simply dragging down the formulas in the spreadsheet.
The 0.015 constant is simply a statistical adjustment to make most of your CCI values fall between -100 and 100.
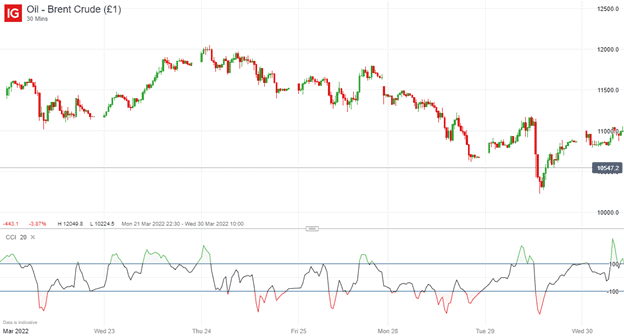
The indicator is usually portrayed at the bottom of your trading chart in most trading software, with two highlighted horizontal lines with values of 100 and -100. The CCI values over 100 are often drawn in green (meaning overbought), whereas values below -100 are usually in red (meaning oversold). Here’s the CCI in action on a continuous Brent crude oil futures contract:
Related Articles
How to use the CCI Indicator in forex trading
We have just learned how to calculate the CCI indicator; however, how do you apply it in your daily trading activity? What exactly does it mean, and how do you interpret it?
Despite its name, the CCI indicator can be used in any market, not only in commodities. Due to its nature, to produce the best results, it is best when used in markets that are somewhat volatile. Developed by Donald Lambert, this technical indicator assesses both the direction and the strength of the price trend and can be used to determine whether to enter or exit a trade.
The CCI indicator is composed of a single fluctuating curve. It is designed to make the majority (around 75%) of its values fall between -100 and 100. Therefore, anything above or below the boundaries (the remaining 25%) is considered abnormal and may constitute a buying or selling opportunity. That is especially the case if the CCI indicator has reached a value above 100 or below -100 (after having reached a below 0 or an above 0 level previously, respectively).
It is helpful to know that the CCI indicator has its limitations. It may occasionally provide late and, therefore, false signals called whipsaws where a rally above 100 or a fall below -100 may come too late, as the price rally/downturn has already run its course and begun to switch direction.
In addition, the CCI indicator is unbound. While other indicators such as the RSI have a clear range and cannot go above 100 or below -100, the CCI can, and therefore, prior overbought or oversold levels may have little impact in the future.
As a result of these limitations, it is best to complement the CCI indicator with other oscillators to achieve the best performance. Also, keep in mind that since the indicator uses the past 20 price ranges as a reference, it is best to avoid trading in quiet market times even though the indicator is at a level of 300.
A simple CCI Indicator trading strategy
As mentioned, the CCI indicator is an unbound indicator, meaning its values can go below -100 and above 100. Therefore, it is best to know which values are typical and which are abnormal in the market you are trading. For instance, in one market, a value of 200 might constitute a viable buying opportunity, whereas in others, a value of 200 is often a whipsaw, and only values starting at 250 and above constitute a profitable buying opportunity in the long run. For this reason, it is crucial to analyse the market you are trading and to know the types of CCI levels that are profitable in the longer term. Back-testing or excel-modelling a specific strategy in a particular market are good ways of knowing profitable CCI levels and will be a crucial part of your CCI strategy. Please be aware that trading is risky and can result in significant losses.
Once you know your profitable CCI levels, you know your entry points. Unless you are trading on a very short time frame, and there is a piece of breaking news announced that might affect the price significantly in the opposite direction to the one in which you want to trade, you can enter a trade every time the CCI crosses that profitable level in an active market. Please be aware that trading is risky and can result in significant losses.
As far as sizing goes, it is best not to allocate more than 2-3% of your capital towards a single trade, as often, you are playing the probability game in trading. If you assign a significant amount of your capital to a single transaction, you risk losing a large chunk to whipsaws which would likely constitute a smaller part of your trades in the long run. Correct sizing is a major part of a trader’s risk management strategy.
Placing reasonable stop-loss levels is vital for profitable trading. While stop-loss levels depend on the volatility of the market at the time of trading and the timeframe you choose, in general, for this strategy, you may want a relatively modest stop-loss, with a reward to risk ratio above 1 (meaning your expected profit divided by your stop-loss should be above the value of 1). If the CCI indicator is correct, and the price is overbought or oversold, then the price has much more room to return from a substantial rise or fall than to rise or fall even further. This should be reflected in your stop-loss. Additionally, you can use a trailing stop to protect your profits. Please be aware that trading is risky and can result in significant losses.
Your exit strategy will also depend on the current volatility in the market. If volatility is high, you can expect prices to move much more than when it is low. As a rule of thumb, look at both the CCI indicator and the price level to determine the correct timing for an exit. Once the price and CCI start reverting (CCI starts moving towards 0), you may consider exiting the trade.
While you may not get every trade right, consistency is vital, and the CCI indicator will give you an edge in the long run, particularly when combined with other indicators.
Example CCI Indicator strategy trades
Let’s look at a couple of CCI indicator trades that illustrate using the strategy we have outlined in the previous section.
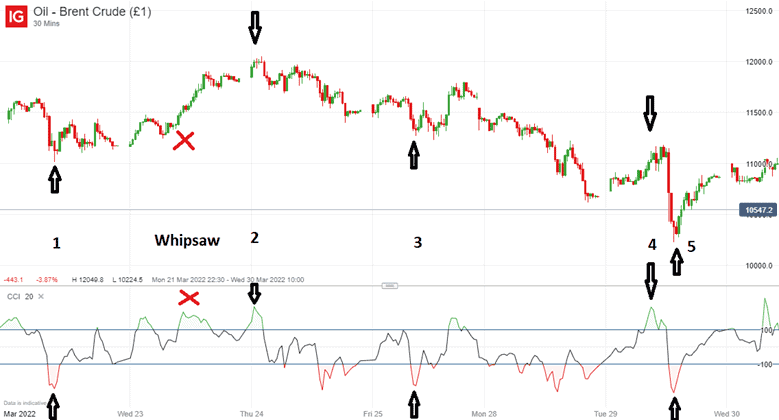
We will take a look at the continuous Brent Oil futures contract in a 30-minute timeframe to pick out a few example trades. As we can see from the graph, we have found several profitable trading opportunities in a relatively short time span, with one clear whipsaw. Please be aware that trading is risky and can result in significant losses. Let’s look at trades 4 and 5 and see how we could have traded them using our trading strategy.
Trade Number 4:
Upon analysing the current market, we have selected a CCI level of 215 or -215 for all our entries. Trade number 4 falls under our radar, as we can see that the contract is highly overbought. As soon as CCI hits 215, we place a trade at 11100, constituting 2% of our capital, with a trailing stop loss of 150 (stops will differ depending on market volatility, expected return on the trade, the timeframe of your choice, and the market itself). The price climbs up a little, just to record a significant fall later. As the CCI indicator approaches a level of 0, we exit the trade at around 10700 for a profit of 400. Please be aware that trading is risky and can result in significant losses.
Trade Number 5:
Unfortunately, we don’t capture the full scope of the fall using solely the CCI exit strategy. However, the market produces another opportunity as the CCI drops below -215. We enter at 10435, using 2% of our capital. In light of the increased market volatility and recent significant market moves, we increase our stop value and put a trailing stop loss of 250. The market continues to fall close to 10200, after switching directions and beginning to rise. As the CCI closes in on 0, we exit our trade at 10750 for a profit of 315. Please be aware that trading is risky and can result in significant losses. While this was not as good a reward to risk ratio as the previous trade, a reward to risk ratio of 315/250=1.26 is still okay.
In this article, we used IG’s web trader to illustrate our trading strategy. If you are looking to get started in trading, several reputable brokers are available.
| Broker | Features | Regulator | Platforms | Next Step | |
|---|---|---|---|---|---|
 Your capital is at risk
Founded: 2014 Your capital is at risk
Founded: 2014 |
|
FSPR | MT4 | ||
 Your capital is at risk
Founded: 2006 Your capital is at risk
Founded: 2006Europe* CFDs ar... |
|
ASIC, FSA, FSB, MiFID | MetaTrader4, Sirix, AvaOptions, AvaTrader, Mirror Trader | ||
|
Between 74-89 % of retail investor accounts lose money when trading CFDs |
|
ASIC, FCA | MetaTrader 4, MetaTrader 5, cTrader | ||
|
|
|
ASIC, CySEC, IFSC | MT4 Terminal, MT4 for Mac, Web Trader, iPhone/iPad Trader, Droid Trader, Mobile Trader, MT5 | ||
 Your capital is at risk
Founded: 2006 Your capital is at risk
Founded: 2006 |
|
CySEC, DFSA, FCA, FSB, SIA | MetaTrader4, MetaTrader5, cTrader, FxPro Edge (Beta) | ||
|
|
|
CySEC, FSC, FSCA, MISA | MT4, MT5, OctaTrader | ||
Conclusion
In this article, we have learned how the CCI indicator is calculated and how to use it in trading. We have shared a viable trading strategy involving the CCI indicator and went on to show specific example trades you can use to learn how to handle this indicator and use it profitably in everyday trading. The CCI indicator is an additional powerful tool for those looking to trade volatile markets, and if you care about making a profit, it is not to be ignored. Please be aware that trading is risky and can result in significant losses.
Continue Learning
- More Forex Indicators Explained
- Relative Vigor Index Explained
- Heikin Ashi Settings
- Momentum Indicator Explained
- Stochastics Indicator Explained

Forextraders' Broker of the Month
BlackBull Markets is a reliable and well-respected trading platform that provides its customers with high-quality access to a wide range of asset groups. The broker is headquartered in New Zealand which explains why it has flown under the radar for a few years but it is a great broker that is now building a global following. The BlackBull Markets site is intuitive and easy to use, making it an ideal choice for beginners.