
Are you looking for a technical trading tool that takes basic candlestick formats and then enhances them to provide a more coherent visual image? There is one trading system that does just that, and it is known as the Heikin Ashi Indicator. If you wish to know more, read on and learn how this unique technical tool is calculated, how you can use it in forex trading, or use it to incorporate a simple trading strategy within your daily routine. lastly, how a real-time forex trading example demonstrates its effectiveness.
The Heikin Ashi indicator is an application that has gained popularity recently after being relatively unknown. It was rediscovered a few decades ago as an improvement upon the interpretation of Candlestick formations, which have been studied for centuries, starting with rice merchants in Japan in the 1700s. Heikin Ashi is said to remove the “noise” from candlesticks and behave much like a moving average. Traders use Heikin Ashi to determine a trend’s relative strength and pinpoint key turning points in price behaviour.
The origin of this indicator goes back to the 1700s in Japan, where Munehisa Homma is given credit for its creation. As a rice merchant, he was an avid trader in rice markets. He is not only known for the Heikin; he has also been called the “God of Markets” and is often named the father of candlestick formations. He wrote one of the first books about the psychology of markets, emphasising that understanding investors’ emotions are critical to trading successfully in rice commodity markets.
Since that era, many books have been written about market and investor psychology and the interpretation of candlestick formations. As with other aspects of Japanese culture, candlesticks and the Heikin do not easily give up their deeper secrets. A trader can react to superficial observations or invest time in active practice sessions to dig deeper into how these tools can improve trading prowess. Read on to learn more.
| Broker | Features | Regulator | Platforms | Next Step | |
|---|---|---|---|---|---|
 Your capital is at risk
Founded: 2014 Your capital is at risk
Founded: 2014 |
|
FSPR | MT4 | ||
 Your capital is at risk
Founded: 2006 Your capital is at risk
Founded: 2006Europe* CFDs ar... |
|
ASIC, FSA, FSB, MiFID | MetaTrader4, Sirix, AvaOptions, AvaTrader, Mirror Trader | ||
|
Between 74-89 % of retail investor accounts lose money when trading CFDs |
|
ASIC, FCA | MetaTrader 4, MetaTrader 5, cTrader | ||
|
|
|
ASIC, CySEC, IFSC | MT4 Terminal, MT4 for Mac, Web Trader, iPhone/iPad Trader, Droid Trader, Mobile Trader, MT5 | ||
 Your capital is at risk
Founded: 2006 Your capital is at risk
Founded: 2006 |
|
CySEC, DFSA, FCA, FSB, SIA | MetaTrader4, MetaTrader5, cTrader, FxPro Edge (Beta) | ||
|
|
|
CySEC, FSC, FSCA, MISA | MT4, MT5, OctaTrader | ||
How is the Heikin Ashi Indicator calculated?
The Heikin Ashi indicator application tool takes the basic candlestick information, the open, close, high, and low, and then “smooths” the erratic portions of the chart in much the same fashion as would a moving average. Traders can then make a better-informed decision without the distractions caused by volatile price action.
A key benefit of the Heikin Ashi indicator is its visual simplicity. Trading channels appear more tightly formed, and major trends are easier to detect and follow. However, it is highly recommended that the use of Heikin Ashi be combined with another indicator to confirm interpretations.
The Heikin Ashi indicator is common on MetaTrader4 trading software, and the calculation formula smooths pricing information by averaging as follows:
- Close = (Open Price + High + Low +Close) / 4
- Open = (Average of Open Price and Close Price of the previous bar)
- High = (Maximum value of the (High, Open, Close))
- Low = (Minimum value of the (Low, Open, Close))
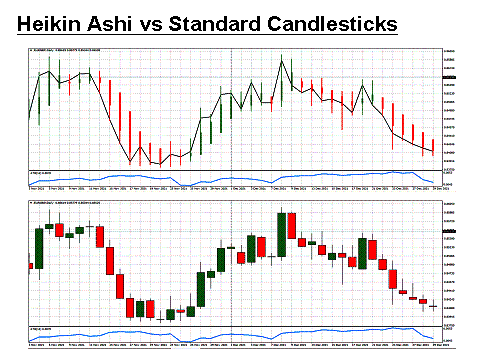
Software platforms generally place the Heikin Ashi indicator as an overlay of existing candlestick formations or separately, as depicted in the above comparison. In the combination chart example above, the Heikin Ashi “bars” are either Green or Red with noticeable size differences from the standard candlesticks presented on the bottom half of the graphic. The line connects closing prices for each day. Although it may take time to become familiar with the new chart presentation, one can immediately recognise the price momentum building on each leg of the rollercoaster ride depicted for the daily “EUR/GBP” currency pair for the latter part of 2021.
Related Articles
How to use the Heikin Ashi Indicator in forex trading
What is the Heikin Ashi Indicator?
This representation of the candlestick model was developed to help the novice trader focus on the trends at hand and not be distracted by market volatility considerations. A helpful insight is to know that Heikin Ashi translates roughly to “average pace”. Its process for redefining basic candlesticks involves averaging various price movements, as noted in the previous section, to reveal the evolving pace of transactions.
The Heikin’s relatively new popularity has yet to spread to several of the major proprietary trading platforms, but MetaTrader4 has offered it for decades. This application tool is often presented in various ways, which can include a simple overlay on the existing candlesticks. For MT4, it goes a step further and recommends special customisations with a line thrown in for good measure. The objective is to highlight strong moves in the market, both up and down.
This averaging process can be helpful for traders to identify trends, place a position, and then stay in the market until an appropriate time to exit. As good as this may sound, averages can sometimes be misleading since they are lagging by their nature. Traders find the Heikin Ashi beneficial whether they are into day trading or prefer to keep positions open for a few days in swing mode.
Candlestick formations are an essential part of every beginner’s introduction to technical forex trading. A Candlestick “bar” is a type of chart that consists of four major prices: high, low, opening and closing. The opening and closing prices form the body of the candlestick bar. These forms have specific names like the “Hammer” or the “Shooting Star”. Some shapes may be very bullish, while others are bearish. An accomplished forex trader will recognise these signals and design an appropriate execution strategy to profit from the signals given. Please be aware that trading is risky and can result in significant losses.
Here are a few more candlestick details. The bar’s body is typically green in colour to indicate that the opening was lower than the closing price. Conversely, if the currency closes below its opening, the body of the bar is filled with the colour red. The rest of the range for the period chosen is reflected by the length of the “wick” and the “tail” on either end of the candlestick bar. A wick or tail may also be called a “shadow”.
Candlestick formations are an important topic to study and incorporate into one’s trading plan, but the breadth of the subject is broad, almost overwhelming for a beginner. The Heikin Ashi was designed to remove this excessive burden for newcomers. Candlestick studies are necessary, but the Heikin simplifies the task and eliminates much of the confusion. Trends are apparent. The direction of momentum is evident, as well.
The Heikin Ashi application reconstructs candlesticks based on mathematically smoothing calculations that are fixed. In the graphic below, the “Red” bars signify that Sellers are dominating the market, and the “Green” bars suggest that Buyers are dominant. Although it may take time to become familiar with the new chart presentation, one can immediately recognise the price momentum building on each of two downturns on either side of a single strong uptrend in the middle of the chart.
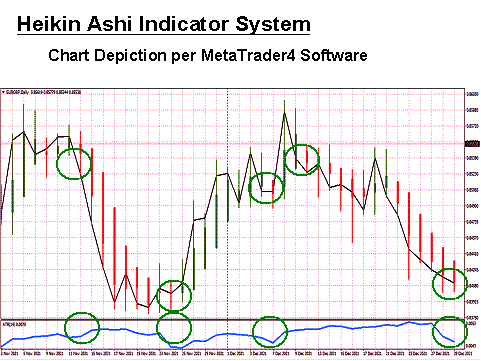
The critical points of reference are when colour changes occur, signifying a shift in momentum between Buyers and Sellers. Trends are easier to follow and ride to victory, especially when another indicator is used for confirmation. In this case, an Average True Range (ATR) indicator was chosen to signal changes in investor sentiment. The ATR is known for alerting the trader that activity is building and that a direction change is imminent. The Heikin Ashi indicator also works well when support and resistance levels are evident.
The Green circles in the above chart signify opportunities for entry or exit from the forex market for the popular “EUR/GBP” currency pair. The Heikin Ashi shines a light on the direction of the imminent trend, while the ATR provides the timing element necessary to know when to act. The ATR on the bottom of the chart also includes Green circles, highlighting when to act on the opportunity.
What are you looking for when you use this indicator system? Here are three focal points:
- The key signal of the Heikin is the emergence of a new trend. The colour shift is evidence, but another indicator is needed for confirmation. Obvious Support and Resistance levels can also fulfil this need for confirmation.
- Look for the preponderance of candles with no shadow, either on the bottom for an uptrend or on the top for a downtrend.
- Size matters with candlesticks. The Heikin modified candlesticks will signal a reversal when their body size begins to diminish, which means that momentum is shifting.
A simple Heikin Ashi Indicator trading strategy
Your objective as a forex trader is to profit consistently 55%+ of the time in your given currency. Forex trading is not a zero-sum game. Please be aware that trading is risky and can result in significant losses. A 50/50 split is not reality. Spread costs, when leveraged, will require that extra 5-10%. A veteran trader will have many small losses and gains, but they will also have two or three trades that account for their winnings. Newcomers, unfortunately, do not have the big winners. They have two to three big losers, where they held on for too long.
You have to be in to win, so to speak. Trading is trying to find the big trades while cutting losers short. If a trading setup does not work out, close your position. There will always be another opportunity just around the corner in the forex world. You can count on it.
With that way of thinking in mind, let’s revisit the previous graphic and discuss a trading strategy:
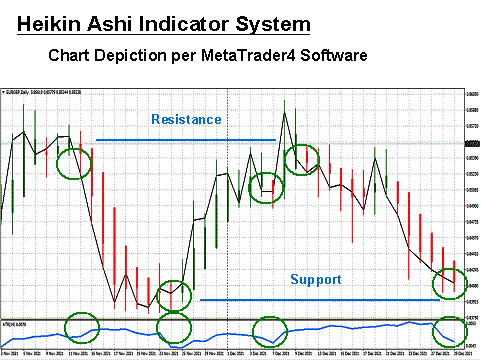
There are three setups in the above chart for educational purposes, which indicate taking action. Each trend bounces between Support and Resistance parameters. Here is a simple trading system for the uptrend in the middle of the chart:
- Determine your entry point from a Support level by noting the Heikin Ashi colour shift and the shift in activity from the ATR.
- Execute a “Buy” order for no more than 2% to 3% of your account.
- Place a stop-loss order at 50 “pips”, the average size of candles, below your entry point.
- Determine your exit point when the Heikin Ashi candles reach resistance levels and signify a colour change.
An aggressive trader might pass on the first exit shift in colour due to the uptick in the ATR. This simple strategy could have yielded a 150-pip profit. Please be aware that trading is risky and can result in significant losses. Now, look at the two downtrends. The first one could have produced a similar gain, but the second downdraft has yet to record a colour shift.
It is nearing resistance, and the ATR has dropped in intensity, as before. Is it time to exit the trade?
Example Heikin Ashi Indicator strategy trade
Let’s take a look at a daily real-time trading setup for the “EUR/GBP” currency pair:
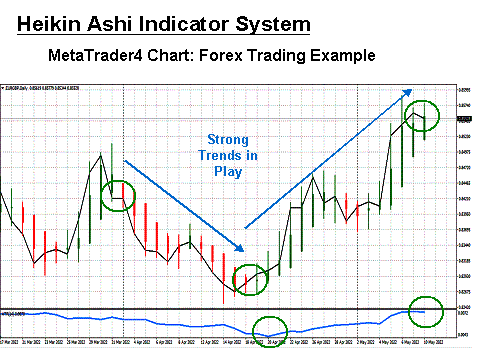
This chart contains two strong movements. In practice, you will have reviewed prior periods to ascertain appropriate support and resistance levels and annotated the chart. For the downtrend portion, the colour shift is your clue, and it so happens that this move coincides with previous resistance levels. When it hits support, and the colour shift occurs, it is time to close one trade and go long on another. Also, notice the ATR drop off, as we noted in the strategy session.
The uptrend bounces off support, a colour shift occurs, and it soon hits resistance. Should you hold or close when the shift to Red happens? A conservative trader would close, but an aggressive trader would hold on. It was only a round of profit-taking, and then it was off to the races again. Please be aware that trading is risky and can result in significant losses. The new time to close will be when the colour shift takes place. The gains here could have been 130 and 260 pips, respectively, two respectable entries for that month’s trading ledger.
Conclusion
Does the Heikin Ashi trading system pique your interest? It can be a powerful tool in your trading arsenal, it helps make charts more readable, especially for spotting trends and getting an in-depth view of the market. However, be sure to practice with it, along with an ATR and annotations for support and resistance. Fine-tune your approach over time, and then enter the forex fray suitably armed.
Continue Learning
- More Forex Indicators Explained
- Demarker Indicator Explained
- ATR Indicator Explained
- Momentum Indicator Explained
- Stochastics Indicator Explained

Forextraders' Broker of the Month
BlackBull Markets is a reliable and well-respected trading platform that provides its customers with high-quality access to a wide range of asset groups. The broker is headquartered in New Zealand which explains why it has flown under the radar for a few years but it is a great broker that is now building a global following. The BlackBull Markets site is intuitive and easy to use, making it an ideal choice for beginners.