

Fibonacci was the nickname given to a talented Italian mathematician named Leonardo of Pisa. He lived during the Middle Ages and was the first person to introduce the Western World and Europe to a special sequence of numbers. These numbers appeared in his book Liber Abaci (The Book of Calculation), which he wrote in 1202. Today these ratios are known as Fibonacci ratios, with the most popular ratio being 1.618 or the inverse of that, 0.618. Mathematicians and scientists refer to this number as the golden ratio.
Not only do Fibonacci ratios work in nature, but they are also widely used in trading and form an important part of a trader’s technical analysis toolset. This article will look at how traders typically use these Fibonacci ratios and how they can form part of a trading strategy.
How are the Fibonacci Ratios Calculated?
The most commonly used Fibonacci ratios are 23.6%, 38.2%, 50.0%, 61.8%, 78.6%, and 100%. These ratios are automatically calculated by the MetaTrader4 platform, as shown in the chart image below.
Source MQL5
Simply select the Fibonacci indicator from the MetaTrader4 toolbar and use your mouse to click and drag the beginning to an ending point of a previous trend. A series of lines with the corresponding Fibonacci ratios will automatically appear on the chart (blue numbers above the lines on the right-hand side of the chart).
The Fibonacci indicator automatically divides the range you selected into Fibonacci ratios.
How to Use Fibonacci Ratios in Forex Trading
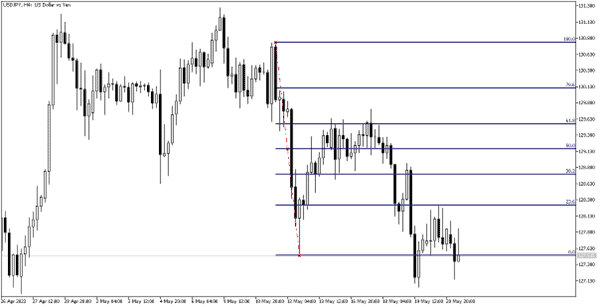
Traders typically use the Fibonacci technical indicator to determine support or resistance levels during a counter-trend reversal (Fibonacci retracement levels) and to predict the direction of future price movement (Fibonacci extension levels).
Source MQL5
The chart above shows a counter-trend reversal that found strong resistance at the 61.8% Fibonacci retracement level before the downtrend continued.
During a retracement, traders will often keep a close eye on the 61.8% Fibonacci ratio, which is related to the golden ratio from where reversals often occur. Keep in mind that the other Fibonacci ratios are also important, and whether they are reached or not will greatly depend on the strength or weakness of the market you are analysing.
Source MQL5
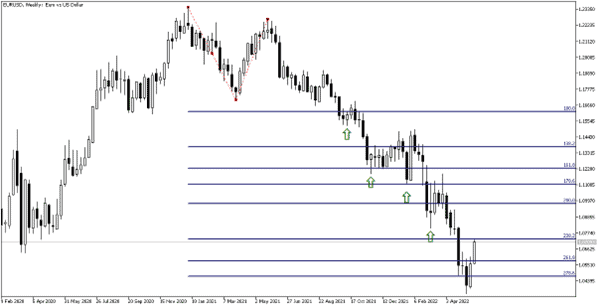
The chart above shows how the Fibonacci extension tool can be used, but, in this scenario, a trader needs to select three anchor points on a chart to draw the Fibonacci extension ratios. For example, the starting point of a downtrend was selected, followed by a low and lastly, a lower high.
MetaTrader4 then automatically projected the Fibonacci extension ratios below the three selected anchor points, i.e., 100%, 138.2%, 161.8%, and 178.6%.
Fibonacci extensions are typically used to determine where a trending market might find support or resistance. Traders often use these extension ratios to judge where they should place their targets or take partial profit.
In this example, price hit the 1.786% Fib ratio, after which a correction occurred. During strong trending market conditions, Fibonacci extension levels beyond the 1.786% ratio can also be used (see final article image example).
Related Articles
A simple Fibonacci Trading Strategy
What follows is a basic trading strategy using exactly the same Fibonacci technical indicator shown previously. Although the Fibonacci retracement and extension tools work well to identify support and resistance levels, they are mostly used in conjunction with other technical analysis techniques to improve a strategy’s performance.
Knowing when to use your Fibonacci drawing tool is an essential part of a strategy and will be explained in the steps below.
Step 1: Determine the trend direction.
The first step relies on determining the current trend direction and when a change in trend has occurred. You might have heard the term “the trend is your friend.” The term simply states that it is better to trade with the trend than against it (the path of least resistance), which is easier said than done in the world of trading.
Source MQL5
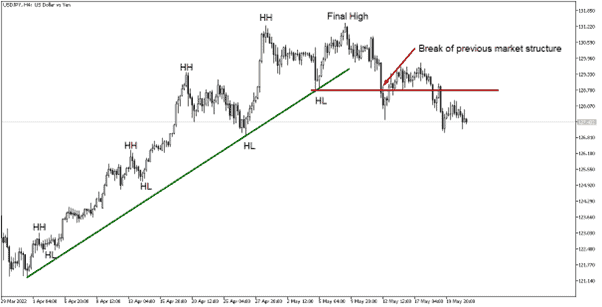
The chart image above shows the structure of an upward trending market. In uptrends, price swings will make a series of higher highs (labelled HH) and higher lows (labelled HL).
The inverse is true during downtrends, where price swings will create lower lows (LL) and lower highs (LH).
Traders will typically use a trendline (green line) to connect the higher lows during an uptrend, and once price breaks below the trendline, a change in trend might occur.
An additional indication that a trend might have ended is when price also breaks below a previous level of market structure (red horizontal line).
Using trendlines during a trending market helps a trader stay on the “right side” of a market when placing trades. Very importantly, they can also alert a trader when a change in trend has occurred.
Step 2: Wait for a counter-trend reversal and draw your Fibonacci retracements.
Source MQL5
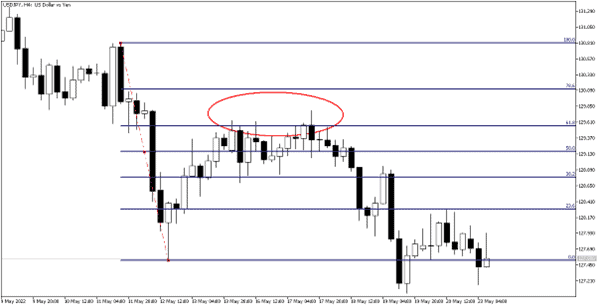
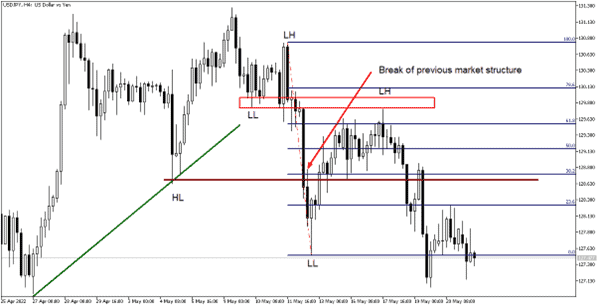
The next step requires that you wait for a counter-trend reversal and the chart image above shows an example where the previous upward trend ended and a new downward trend started.
Just after price broke the upward sloping trendline and previous market structure, a low formed, and a correction followed. This was an indication that the previous uptrend changed to a downtrend and that the strategy requires a trader to look for selling opportunities after a counter-trend reversal.
Using the Fibonacci retracement tool is one way to anticipate where a lower high (LH) might form before the next move lower resumes. In most cases, it will be worth the patience to wait for price to hit the 61.8% Fibonacci ratio and to assume that a reversal might occur at that level.
In this example, the price hit the 61.8% Fibonacci retracement level numerous times but failed to break and close above it. This price behaviour can be seen as a weakness and signals that a correction is potentially nearing an end.
Step 3: Plan your entry, stop loss, and target levels.
 Source MQL5
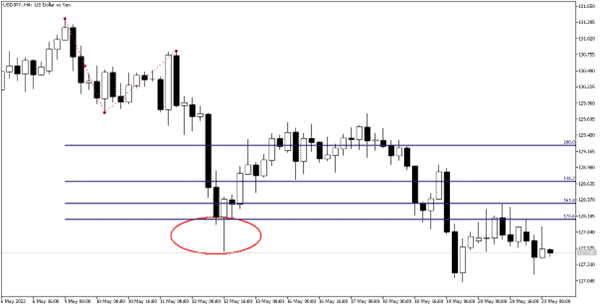
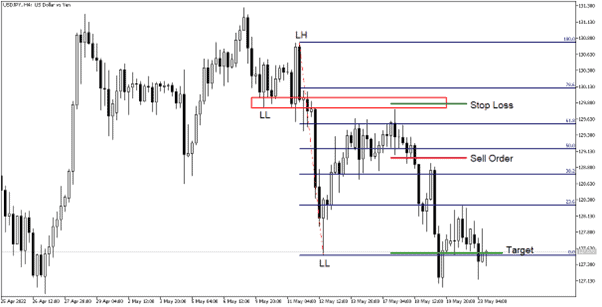
The final strategy image shows the order levels that could have been used to enter a short position after price got rejected from the 61.8% Fibonacci ratio.
The sell order was placed below a bearish reversal candlestick with a stop loss a few pips above the same candle. The target level was placed at the beginning point of where the correction started.
Using these levels allows for a healthy risk vs reward ratio, which is an integral part of trading and needs to be considered before you trade. Never risk more than you can afford to lose and consider only risking 1-2% of your capital on a trade.
With this basic trading strategy, only Fibonacci retracements were used. Still, if a larger trend continuation is expected, multiple targets can also be placed at important Fibonacci extension levels, like the 100%, 138.2% and 161.8% extension ratios. Some of these Fibonacci extensions target examples are shown below.
The Best Forex Demo Accounts
To master the Fibonacci indicator it is important that you practice it. Reading the signals the indicator correctly timing your entry and exit points are skills that need to be mastered in order to maximise your profits. This is where a forex demo account comes in: It allows you to practice your new strategy without risking any of your hard-won capital. Below we have picked out some of our favourite forex demo accounts to help you out.
| Broker | Features | Regulator | Platforms | Next Step | |
|---|---|---|---|---|---|
 Your capital is at risk
Founded: 2014 Your capital is at risk
Founded: 2014 |
|
FSPR | MT4 | ||
 Your capital is at risk
Founded: 2006 Your capital is at risk
Founded: 2006Europe* CFDs ar... |
|
ASIC, FSA, FSB, MiFID | MetaTrader4, Sirix, AvaOptions, AvaTrader, Mirror Trader | ||
|
Between 74-89 % of retail investor accounts lose money when trading CFDs |
|
ASIC, FCA | MetaTrader 4, MetaTrader 5, cTrader | ||
|
|
|
CySEC, FSC, FSCA, MISA | MT4, MT5, OctaTrader | ||
|
|
|
ASIC, CySEC, IFSC | MT4 Terminal, MT4 for Mac, Web Trader, iPhone/iPad Trader, Droid Trader, Mobile Trader, MT5 | ||
 Your capital is at risk
Founded: 2006 Your capital is at risk
Founded: 2006 |
|
CySEC, DFSA, FCA, FSB, SIA | MetaTrader4, MetaTrader5, cTrader, FxPro Edge (Beta) | ||
Example Fibonacci Strategy Trades
Source MQL5
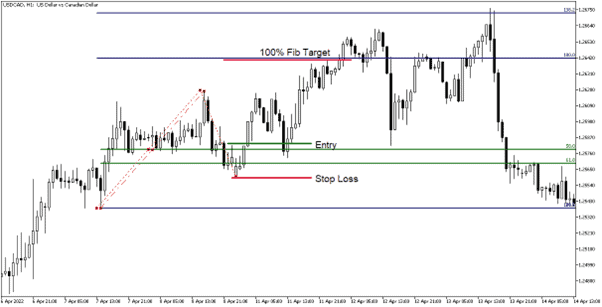
The following chart shows a long trade after a retracement that ended slightly below the 61.8% Fibonacci retracement level and how the Fibonacci extension tool can be used to position a target (in this case, at the 100% extension level).
Source MQL5
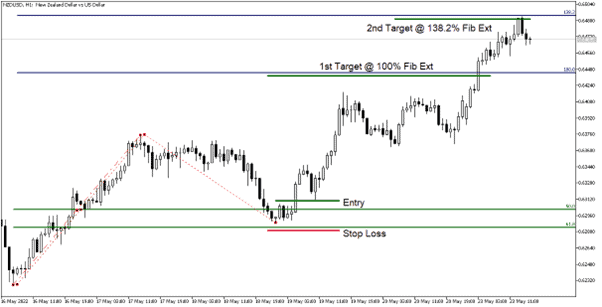
This trade example shows how to determine multiple target levels using Fibonacci extension ratios. The third anchor point used for drawing the Fib extensions was positioned at the low where the assumed correction ended.
Note how both examples offered much bigger returns versus the initial risk taken. Not all trades work out all the time, so it’s essential to have a strategy that covers your losses whilst maximising your profits over the long run.
Source MQL5
The final example image above does not display any trade entries but clearly shows how price tends to stop at Fibonacci extension levels during a strong trending market.
Knowing, in advance, that traders tend to take profit at these levels can be incredibly beneficial since a correction is likely to occur. Then, by following the strategy mentioned above, new trading opportunities can present themselves when these corrections end and the trend resumes.
Conclusion
This article explored the origin of Fibonacci ratios, how they are calculated and how they can be used as part of a simple trading strategy.
Using Fibonacci ratios to find areas of support or resistance can provide us with many tradable opportunities. Since the Fibonacci indicator is such a common and well-known technical analysis tool, it makes sense to incorporate it into your trading method.
Knowing which Fibonacci ratios most traders are watching during a correction or trending market can greatly assist traders in timing their entries better and placing their targets.
There are many more ways that Fibonacci ratios can be used in trading, but this article should spur your interest in exploring other techniques that can aid you in becoming a better trader.
Continue Learning
- More Forex Indicators Explained
- RSI Indicator Explained
- ATR Indicator Explained
- Simple Moving Average Strategy
- Stochastics Indicator Explained

Forextraders' Broker of the Month
BlackBull Markets is a reliable and well-respected trading platform that provides its customers with high-quality access to a wide range of asset groups. The broker is headquartered in New Zealand which explains why it has flown under the radar for a few years but it is a great broker that is now building a global following. The BlackBull Markets site is intuitive and easy to use, making it an ideal choice for beginners.