
The Ichimoku Kinko Hyo, or Ichimoku for short, indicator or trading system, is a relatively recent development originating in Japan back in the 1960s. The system combines a variety of indicators to create an overall picture of the market, thereby providing traders with high probability trading signals. The system was used primarily in the commodities and futures markets, but forex traders have recently discovered its usefulness in their own medium. Traders that handle positions over a few days are the primary beneficiaries since the system works best over longer timeframes. The chart can appear visually complex, but signals are easy to detect.
Source: eToro
Your first impression of the Ichimoku trading system may be that it is too much to manage, but the Kumo Cloud portion of the indicator can stand on its own. The Cloud projects a form of future support and resistance, and this representation alone is a valuable tool when trying to predict how the market might react going forward.
Has the Ichimoku indicator now piqued your interest? Read on to learn more about its origin, how it is calculated, how to read its signals, how it can be used in a simple trading system, and a few real-time trading examples. By the end of this article, you should be able to make an informed decision about this indicator and if it is the right tool for you to use in future trading strategies.
Ichimoku Background and Overview
Forex traders are always looking for better and brighter indicators, a new tool that would change their trading experience overnight. However, innovation and adapting to changing market conditions are the hallmarks of being a consistent and effective trader. The Ichimoku trading system could fall within this category of a new, innovative approach for interpreting market signals that could improve your trading prowess.
The origins of this indicator system can be traced back to the late 1930s in Japan. Goichi Hosoda, a journalist by trade, developed this trading system and spent the next 30 years perfecting its use before releasing it to the public. His professional alter-ego was Ichimoku Sanjin, which means “what one man in the mountain sees”. He incorporated a portion of this pseudonym in his innovative system, calling it Ichimoku Kinko Hyo, which, when freely translated, means “one glance equilibrium chart”.
It soon became popular in various trading arenas, predominantly in commodities and futures markets. This migrated quickly, however to forex trading. Today, several market commentaries in Asia have made it a practice to refer to the positioning of the Kumo Cloud as its most predominant feature. This feature is an accepted way to explain how prices have and will behave in the future. A measure of its appeal is that investors will often hover about the cloud before a breakout commences.
The Ichimoku indicator is now available on most trading platforms, a sign of its growing popularity. On the ever-popular MetaTrader4 platform, it is listed as an Oscillator, that category of quantitative methods designed to signal overbought and oversold conditions. This system can be visually intimidating to the beginner, but a wealth of material explains how effective this tool can be and how various components interact to provide signals.
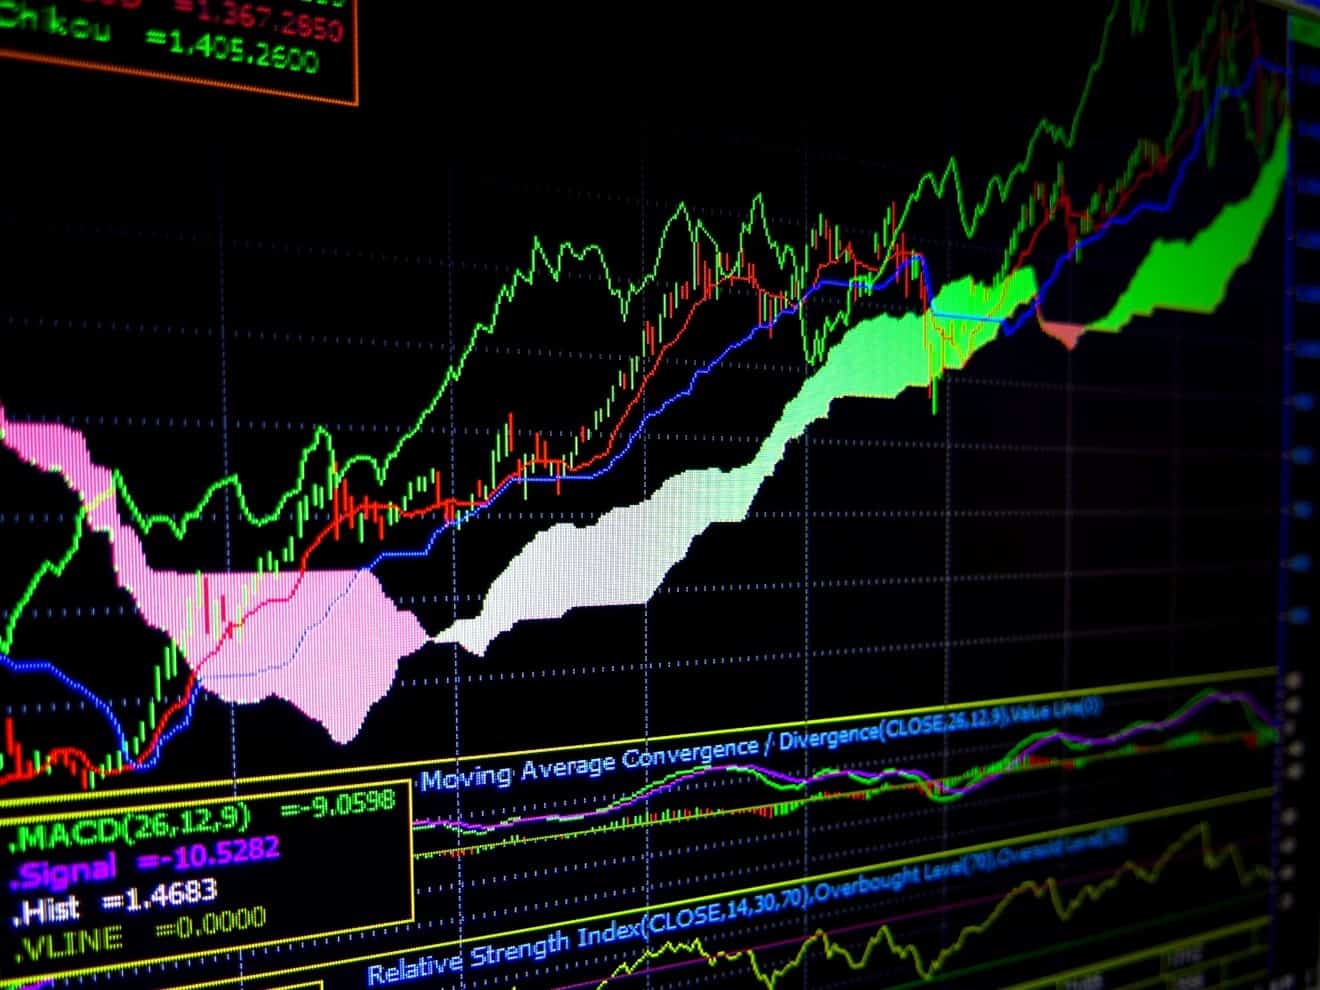
In some literature, the Ichimoku indicator has been classified as a trend momentum identification system due to its use of moving averages. These averages also depart from traditional calculation methods. They rely upon an average of the high and low of a candlestick, not on its open or close. The system also has the unique quality of projecting into the future while depicting prior market sentiment. The names of its various components can, however, be confusing. Nomenclature follows Japanese tradition, but the Kumo Cloud remains its defining feature with three additional line indicators that help signal potential trading patterns and set-ups.
While much of the Japanese literature related to the Ichimoku and its use has yet to be translated, most Western journals refer to the system’s unique graphic environment. A summary of its components follows:
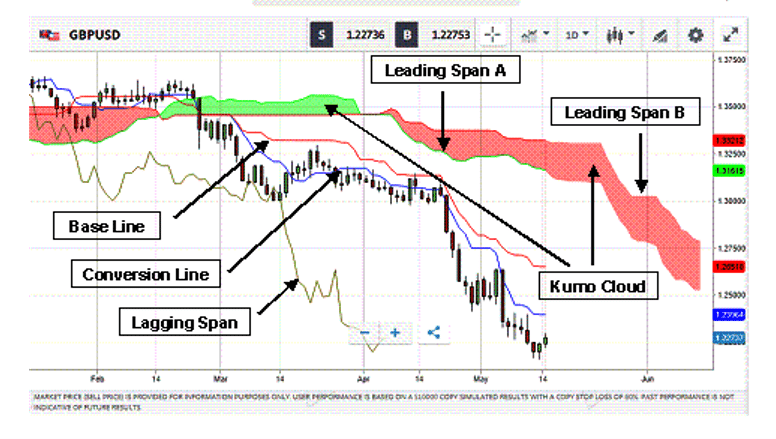
- Kumo Cloud: These areas depict support and resistance derived from previous pricing data. The borders of an up cloud are known as Senkou (Leading) Spans A and B. Key alerts occur when candlesticks exit the cloud, various lines enter or pass through the designated regions, or when the cloud changes colour. In this overview depiction, the green cloud is supported, and the red clouds are resistance.
- Tenkan Sen and Kijun Sen: These lines, like moving averages, are calculated from previous highs and lows over nine and 26 periods. The blue conversion line, or Tenkan-sen, is the quicker of the two, and its intersections are key trading signals, while its slope tends to measure momentum. The Kijun Sen or Base Line is in red.
- Chikou Span: This line, noted in gold as the Lagging Span, measures market sentiment based on current closing prices but is moved backwards, typically 26 time periods. Its position relative to pricing data indicates whether sellers or buyers dominate the action, while the cloud’s position may portend resistance if it enters the picture.
This forex trading system combines these numerous lines to present a complete picture of the situation, leaving the trader with a better basis for evaluating potential patterns and trade set-ups and offering a higher probability of success. Position traders that trade over longer time horizons than a day or two is the typical audience as the system works best over daily or weekly timeframes.
As with other technical systems, short-term volatility can reduce the system’s effectiveness, leading to jagged and confusing results. Ranging periods can also yield inconclusive results. From an overall perspective, however, longer timeframes help eliminate market noise and increase the effectiveness of this technical support tool.
Ichimoku Components and Their Formulas
The Ichimoku system has many moving parts, thereby negating the need for additional indicators for confirmation of trading signals. It may still prove wise to have extra support, but it may be more confusing than necessary for this discussion. Five separate line calculations must be performed, and two of them are moved into the future. As the lines associated with the cloud cross over one another, the colour shading of the cloud also flips back and forth.
Although these calculations appear tedious and complicated, forex trading platform software quickly performs the necessary work behind the scenes. Here are the formulaic steps involved, along with both the Japanese names and the westernised translations:
- Tenkan Sen (Conversion Line – Blue): Compute the average of the sum of nine previous period highs and nine period previous lows.
- Kijun Sen (Base Line – Red): Compute the average of the sum of 26 previous period highs and 26-period previous lows.
- Chikou Span (Lagging Span – Gold): Plot the previous 26 period closes.
- Senkou Span A (Leading Span A – Green): Compute the Conversion Line and the Base Line average. Take each data point and move them 26 periods into the future.
- Senkou Span B (Leading Span B – Red): Compute the average of the sum of 52 previous period highs and the 52 previous period lows. Take each data point and move them 26 periods into the future.
- Kumo Cloud: The space between Senkou Spans A and B are to be coloured to represent a cloud. When the lines cross, the colour, either green or red, is flipped.
Source: eToro
Let’s revisit the overview chart and review the results of these calculations. For clarity, we have switched to the typical connotations you will find on Western trading platforms. The Ichimoku trading system consists of the cloud and three other line indicators. The blue conversion line has a 9 setting that allows it to move more quickly, its slope being a good measure for momentum. The slower red baseline is framed over 26 periods. The gold lagging span represents current closing prices moved back 26 periods, thereby comparing the overall trend with current price momentum.
The cloud is the most interesting of these components. It acts much like a filter, and when prices break through this barrier, accompanied by a subsequent move above or below the colour shaded regions, a breakout condition exists. The flipping of the colour scheme is one more unique characteristic. When Span A is above Span B, the Cloud is Green and acts as support. Conversely, when Span A is below Span B, the Cloud is Red and acts as resistance. The Cloud is also projected forward to alert the trader of what may lie ahead.
Position traders are the primary users of this charting system since longer timeframes work best within this tool. The above graphic is a Daily chart for the GBP/USD currency pair, but 4-Hour and weekly versions have also gained support. The key points of reference are when the various components intersect. A wealth of information is available about the Ichimoku, but a conservative trader waits for pricing candlesticks to break free from the cloud and other lines. A wise trader will typically look for more confirmation to bias the odds in his favour.
How to Read an Ichimoku Chart
The beauty of the Ichimuko trading system may also be its weakness. Five component lines do give a broad perspective as to how prices are behaving in the marketplace, but with so many inputs, a trader can easily become distracted and make incorrect judgments. However, with multiple views of the price action, the trader can perceive a higher probability of trading opportunities, but only after a sufficient training period. Japanese sushi chefs take years to perfect their art: the same might be said about the Ichimoku charting system, but years may be an exaggeration.
To use this indicator system effectively, it is necessary to focus on the individual parts and form an overall judgment. The moving average components are straightforward, but the cloud is the defining structure of this system. Let’s break each component down to see where significant messages reside.
First, we have the base and conversion lines, two separate moving averages of 9 and 26-period durations. As with standard moving average combinations, the crossovers are points of interest. When the faster conversion line crosses upward, it is bullish, and it is bearish when its cross is downward. During ranging periods, the lines intertwine and are inconclusive, but if they cross within the cloud, then it is significant.
The Chikou Span or Lagging Line is the most misunderstood of the bunch. It pushes back a plot of closing prices for 26 periods, but how does this help the trader? In a way, it reflects previous support or resistance. The positioning of current prices relative to this line can indicate bullish and bearish trends. When this line interacts with the previous pricing, it signifies a sideways or choppy market. It can also denote momentum based on how far away it is from the other four lines. This means that more distance equates to greater momentum in the trend.
The star of this indicator system, however, is the cloud. Traders have become so enamoured with it that they often discard the other lines and use the cloud as a standalone component of their trading strategy. Traders and analysts give it credence by using it as a guidepost before an imminent breakout, a good thing to know for potential set-ups. Here are just a few of its helpful benefits:
- When the candlesticks are above the cloud, a bearish trend is indicated.
- When prices are below the cloud, bearish tendencies are in order.
- When the cloud is continually flipping colour back and forth and/or prices are stuck within the cloud, the market is ranging and marking time, a time for patience.
- A Green Cloud is bullish, representing support, whereas a Red Cloud is bearish and denotes resistance.
- The size of the cloud measured by its width is a good gauge of the trend’s strength.
- The rate that the two lines of the cloud move apart is also an indication of increasing or decreasing momentum.
- A glance at the colour of the cloud discloses the direction of current price behaviour: green is up, while red is down. Quick flips and a thin cloud denote ranging price behaviour.
- Finally, and most importantly, when candlesticks thrust forcefully through the cloud, it is a definite signal of a trading opportunity. Best of all, the cloud can help you hold onto a forceful trend after such a thrust. A wise trader holds the position until prices begin returning to the cloud.
Related Articles
A simple Ichimoku Trading System
Practising sessions with the Ichimoku indicator or with just the cloud are highly recommended. It will teach you how to make one glance quickly and then react. Although 4-Hour and up timeframes seem the most effective, day traders have also used the cloud in short timeframes, where prices tend to traverse edge to edge. However, our focal points will be Conversion/Base Line crossovers when prices break through the cloud and then close.
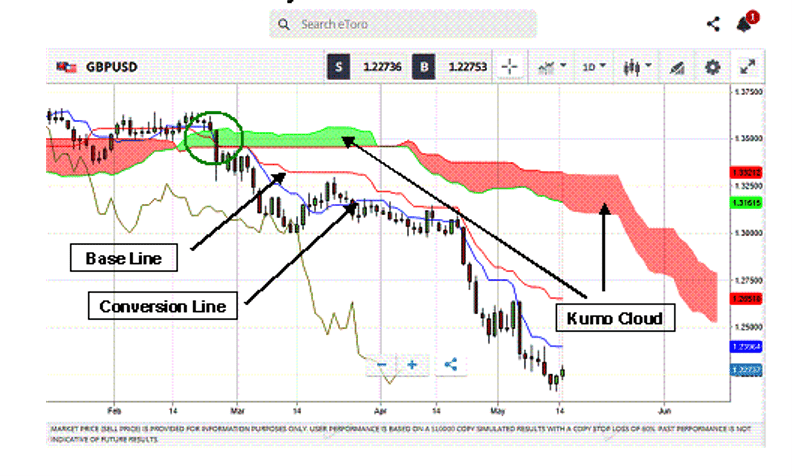
Let’s look back to our overview chart and review the generated signals. The green circle on the chart below would be our optimal entry point to sell the British Pound and go short.
Source: eToro
A simple trading system would then be:
- Determine your entry point after pricing candlesticks forcefully close below the cloud, and the two moving averages of the conversion and base lines cross.
- Execute a Sell order that puts no more than 2% to 3% of your account at risk.
- Place a stop-loss order at 60 pips, the average size of the candlesticks preceding the breakout, above your entry point.
- Determine your exit point after the conversion line crosses back over the base line.
In this swing or position trade example, the trade remains open. When prices begin to head back towards the cloud, it is time to prepare for an exit. Steps 2 and 3 are wise risk and money management principles to be followed. With a trend this strong, it would also have been wise to use trailing stops to lock in your profits. This simple trading system would have already netted over 1,000 pips, but gains of this scale are rare.
The Best Forex Demo Accounts
To master the Ichimoku indicator it is important that you practice using it. Reading the signals the indicator gives and correctly timing your entry and exit points are skills that need to be mastered in order to maximise your profits. This is where a forex demo account comes in: It allows you to practice your new strategy without risking any of your hard-won capital. Below we have picked out some of our favourite forex demo accounts to help you out.
| Broker | Features | Regulator | Platforms | Next Step | |
|---|---|---|---|---|---|
 Your capital is at risk
Founded: 2014 Your capital is at risk
Founded: 2014 |
|
FSPR | MT4 | ||
 Your capital is at risk
Founded: 2006 Your capital is at risk
Founded: 2006Europe* CFDs ar... |
|
ASIC, FSA, FSB, MiFID | MetaTrader4, Sirix, AvaOptions, AvaTrader, Mirror Trader | ||
|
Between 74-89 % of retail investor accounts lose money when trading CFDs |
|
ASIC, FCA | MetaTrader 4, MetaTrader 5, cTrader | ||
|
|
|
CySEC, FSC, FSCA, MISA | MT4, MT5, OctaTrader | ||
|
|
|
ASIC, CySEC, IFSC | MT4 Terminal, MT4 for Mac, Web Trader, iPhone/iPad Trader, Droid Trader, Mobile Trader, MT5 | ||
 Your capital is at risk
Founded: 2006 Your capital is at risk
Founded: 2006 |
|
CySEC, DFSA, FCA, FSB, SIA | MetaTrader4, MetaTrader5, cTrader, FxPro Edge (Beta) | ||
Examples of Ichimoku Strategy Trades
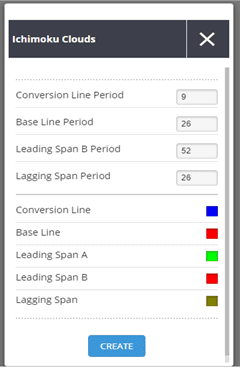
Let us now take this simple Ichimuko strategy and look at a real-time situation, using the full Ichimuko trading system and then the same example with just the cloud and other more traditional indicators. First, go to your settings for the indicator. You can always customise these criteria but do remember that Goichi Hosoda spent 30 years working to perfect them. If you only want the cloud, set the colours for the Conversion, Base, and Lagging Span lines to White or blank. Here are the defaults:
For our trade example, we have chosen the EUR/JPY currency pair on a daily timeframe. We have the complete set of Ichimoku indicator lines and the cloud in this first example. We have inserted green circles in the chart below to mark critical focal points, and the optimal entry and exit points for this example will be made at the A, B, and C designations. This example highlights the good points as well as the drawbacks of this trading system.
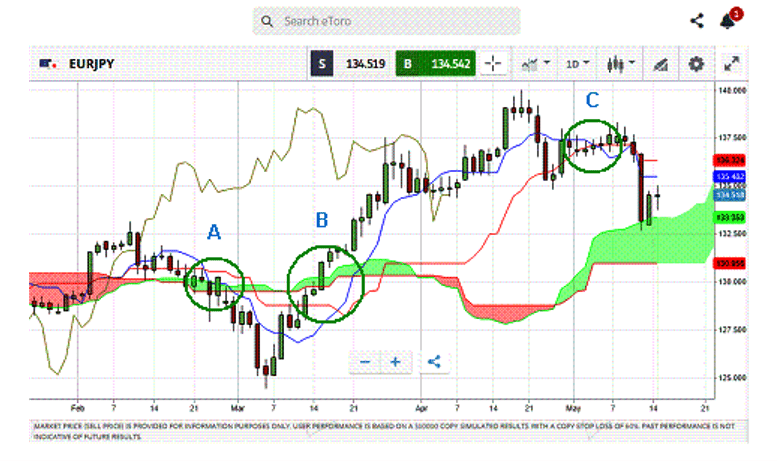
Source: eToro
Before we discuss this chart, take a moment to review the same example with only the cloud and with two other indicators – Stochastics and the Average True Range (ATR):
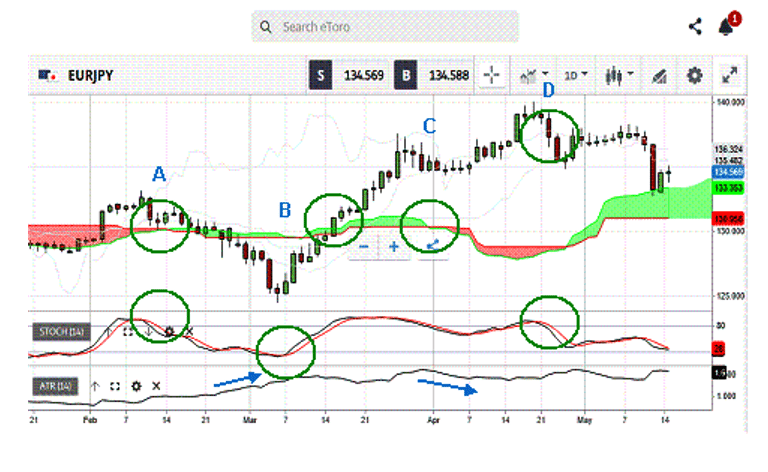
Source: eToro
The first difference to note is that the Cloud Only chart has more green circles or decision points of interest than the Ichimoku system standing alone. The second example is an adaptation of both Eastern and Western methodologies to arrive at a trading system that can be effective in today’s foreign exchange market. In both instances, the Yen had been stuck in a ranging mode at the beginning of the chart. Under these circumstances, traders are ready to act. The eager ones may have jumped early, but a classic head-fake ensued.
In the first example, the conversion and base lines cross, and the candlesticks penetrate the cloud forcefully. Our strategy says to go short, but the moving averages do nothing to warn us of a head-fake until the dip has concluded. A trade from A to B would have offset, but the signal switched to suggest a Buy and long position. Note that the clouds are not very thick, suggesting that momentum is weak. The exit point appears at C, a gain of roughly 4.7% over 32 sessions.
In the second example, we might enter the trade earlier at A, then close at B and go long, based on the Stochastics and the rapid slope change of the ATR. The cloud confirms our Buy decision. A conservative trader might exit at C, but an aggressive one might stay the course until D. It is also interesting to note that Yen investors respected the cloud at the end of the chart, hovering at the Senkou Span A boundary. The potential gains from this combined trading scheme would have ranged from roughly 10% to 13%, an impressive result.
Concluding Remarks
The Kumo Cloud has been slow in coming to the West, primarily due to translation delays, but a wealth of explanatory material now exists on the internet. The entire Ichimoku Trading System may seem overly complex at first glance, but after you break it down the Kumo Cloud portion of the system can be helpful and supplement other trading strategies on a standalone basis. Using the cloud to identify signals in the direction of a bigger trend, especially an uptrend, can prove advantageous, so traders should keep an eye out for bullish signals when prices approach the cloud on a pullback or consolidation.
As with all indicator-based trading systems, the Ichimoku is not perfect, but it can be consistent enough to provide the trader with an advantage over time. This advantage can then translate into consistent profits in the forex trading arena. Still, it is highly advised that you practice on a demo system to acquaint yourself with the intricacies of this set of indicators. Incorporate it into your step-by-step trading plan and fine-tune it before putting your real capital at risk.

Forextraders' Broker of the Month
BlackBull Markets is a reliable and well-respected trading platform that provides its customers with high-quality access to a wide range of asset groups. The broker is headquartered in New Zealand which explains why it has flown under the radar for a few years but it is a great broker that is now building a global following. The BlackBull Markets site is intuitive and easy to use, making it an ideal choice for beginners.