

The “Parabolic Stop and Reverse”, or “SAR” indicator, was developed by J. Welles Wilder Jr. to determine the end of a trend and supplement other trend-following systems. Traders use the indicator to designate optimal entry and exit points. This rather scientific-sounding system gets its name from the parabolic form of “dots” that follow underlying trends. The dots appear on the chart above and below related candlesticks and disconnect and reverse with trending changeovers.
The SAR is not technically classified as an “oscillator”, but the indicator is often used with oscillators. The parabolic dots are easy to interpret. Each point represents a potential reversal in pricing behaviour. The dots appear below price indicia on an uptrend and above them on a downtrend. The SAR indicator works best in trending markets but can give false signals in ranging sideways markets. To counter this apparent weakness, it is advisable to team the SAR up with another indicator, as the ADX depicted below, to assist with its interpretation.
John Wilder was a living legend in the world of technical analysis until his death in 2021 at the age of 85. A native of Norris, Texas, this American pioneer majored in Mechanical Engineering but chose a career in real estate development while pursuing his passion for developing a series of technical indicators for traders and investors. While his reputation in technical circles is well established, forex traders are more familiar with his innovative creations: the Relative Strength Index (RSI), the Average True Range indicator (ATR), the Average Directional Index (ADX), and, of course, the Parabolic SAR.
One of Wilder’s favourite quotes was: “Some traders are born with an innate discipline. Most have to learn it the hard way.” Having learned it the hard way on his own, Wilder set out to develop a family of technical indicators to help tame the vicissitudes of the market and help the average trader gain a modicum of discipline. Although the RSI is perhaps, his most famous contribution, he actually recommended that the SAR be combined with the ADX.
Wilder created the SAR to focus on the potential for market reversals to occur in the direction of prices for a chosen asset or security. Although its signals have a high degree of accuracy in strong trending markets, it is a lagging indicator at best. It can mislead the trader with false-positive signals during weak or ranging market behaviour. The SAR can often point to a change in price direction, but the use of another indicator is required to gauge the strength of the trend.
There is another unique property of the SAR. Price points rarely travel beyond the borderline indicated by the parabolic dots, which are bearish when they appear above prices and bullish when below. The dots then offer a reasonable tool for placing stop-loss order limits for risk management purposes. In any event, the SAR is unique in its presentation, as the parabolic curves interchange their positioning directly upon the pricing data with visual disconnects.
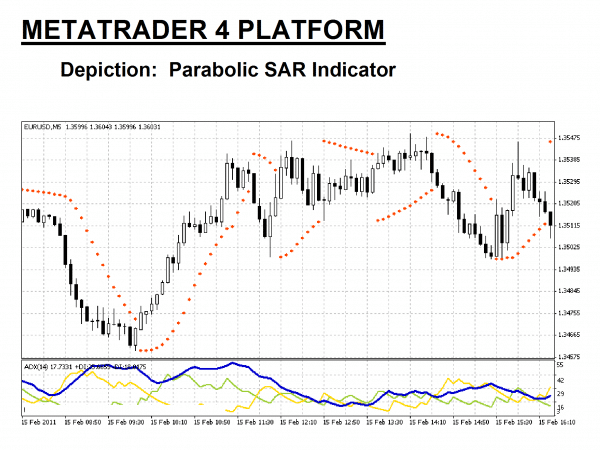
The overview chart presented above, a “EUR/USD” currency pair at 5-Minute intervals, illustrates both the strengths and the weaknesses of the Parabolic SAR. The first third of the chart displays a strong trend in process, while the remainder returns to ranging behaviour. The dots are pronounced for a more extended period during the trend and then appear short and choppy after the trend has run its course. The ADX confirms the presence of both strength and weakness, as well.
Would you like to incorporate a Parabolic SAR strategy within your daily trading routine? We will provide the information below to that effect, advising you on how to use the SAR in forex trading, and educating you on how the indicator is calculated. We will also touch on common SAR trading strategies, but two things must be understood upfront if you are to be successful. The SAR is not perfect. False signals are a reality, especially during ranging periods, but consistency is your objective, which can be achieved if you also utilize one or two other indicators for confirmation. Secondly, practice sessions are a must if you are to make the best use of this strategy. Use your demo system to perfect your approach.
How is the Parabolic SAR Indicator calculated?
If you are beginning to fear that an algebra refresher course might be necessary, never fear. The calculation formula sequence can be rather involved, but today’s modern trading platform software will handle those calculations in the background. You will also find that the Parabolic SAR indicator is common on MetaTrader4 trading software and proprietary systems offered by forex brokers. It is a valuable tool, as are Wilder’s other creations.
For each step in a trend, the SAR value is calculated one period before. In other words, today’s value is calculated from yesterday’s data. The formula consists of the following five steps:
- “SAR+1” = “SAR” + A (“EP” – “SAR”) where “SAR” and “SAR+1” are yesterday’s and today’s SAR values.
- “EP”, or Extreme Point, equals the highest price point during an uptrend or the lowest price point in a downtrend and is updated if a new “max” or “min” is observed.
- “A” is the acceleration factor. In forex trading, it is set to start at “0.02”. It is raised by a similar amount every time a new EP record is recorded. As “A” increases, the SAR converges towards the price of the currency. A maximum value is also set, typically “0.20”.
- There are also “boundary” considerations that modify the SAR in case the iterative calculation produces a value outside of the general form.
- There are also additional rules that apply when a trend suddenly switches. EP and A values are reset, and the process starts again.
Wilder also suggested that the Parabolic SAR and the ADX indicators work well in tandem. Software programs perform the necessary computational work and produce a Parabolic SAR indicator, as displayed in the upper portion of the previous overview chart. The Average Directional Index indicator (ADX), the heavy Blue line, appears on the bottom part of the same chart. The ADX reflects the strength of a trend but not its potential direction or momentum.
How to use the Parabolic SAR Indicator in forex trading
If you are looking for a pure oscillator, the Parabolic SAR will not work for you, but it is a useful technical tool when used in tandem with oscillators. The parabolic dots flow in a familiar pattern, but they are constantly being calculated, even when prices level out. This lagging quality resembles results for a moving average with a twist. Even though the dots appear below price indicia on an uptrend and above them on a downtrend, there is a separation component. Be advised that this separation is not necessarily a reversal.
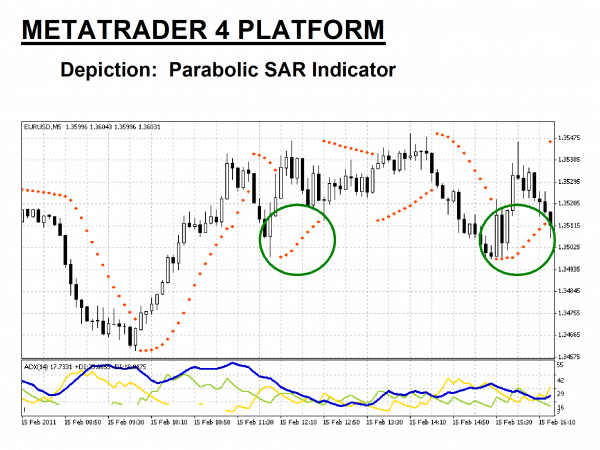
The Parabolic SAR does have one variable setting for the “A” value or acceleration factor. In our “EUR/USD” chart, the acceleration factor has been given a value of “0.02”. The maximum A value is set at “0.20”. Forex traders have determined these values to be to their liking, but your practice time is an excellent place to experiment with other settings. In the example above, a significant down and uptrend occur at the beginning of the chart, followed by a sideways “choppy” movement.
The key reference points are the “switchover” points above and below the candlesticks. The Parabolic SAR attempts to signal the beginning and end of a forceful trend. As previously noted, the ADX indicator is highly recommended as a partner for the SAR to get a measure the strength of the prevailing trend. The ADX readings for both initial trends on the chart are above “40”, representing strong trends in place. However, during the “choppy” portion of pricing data, two false SAR signals in the “Green” circles were produced, accompanied by weak ADX values.
As with any technical indicator, a Parabolic SAR chart will never be 100% accurate. False signals can occur in ranging price behaviour, as shown above. However, the positive signals are consistent enough to tilt the odds in your favour, the key to producing a successful trading experience. Skill in interpreting and understanding SAR signals must be developed over time, preferably on a virtual demo system, before you ever put real capital on the line. Complementing the SAR tool with the ADX indicator is always recommended for further confirmation of potential trend changes.
Related Articles
A simple Parabolic SAR Indicator trading strategy
Let’s take a quick re-look at our chart example and devise a simple trading strategy using the Parabolic SAR indicator, coupled with the ADX indicator. The following steps are for illustrative purposes for this chart alone. Different results can occur under different circumstances. All indicators base their signals on previous pricing behaviour, but the past does not always repeat as expected. In this particular case, follow the chart annotations and steps provided below for a simple SAR trading strategy:
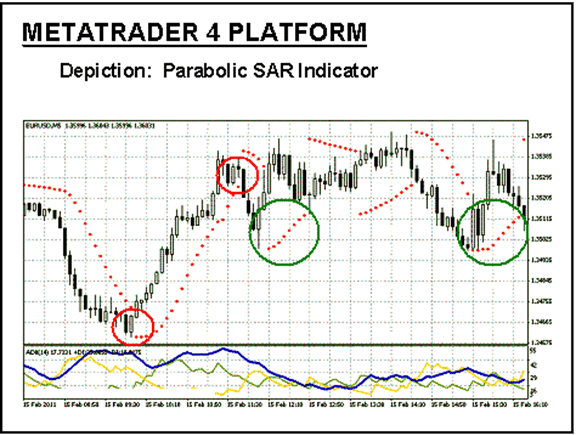
- Determine your entry point after the SAR switchover for an uptrend accompanied by a strong ADX reading in excess of 25 (40+ in this case).
- Execute a “Buy” order for no more than 2% to 3% of your account.
- Place a stop-loss order at 15 “pips” below your entry point, based on the average spacing between the SAR dots and the candlesticks.
- Determine your exit point when the SAR switches over at the end of the trend and the ADX values begin to wane, signifying a weakening trend.
Steps “2” and “3” represent prudent risk and money management principles to ensure that a fickle market does not ruin your day. The size of your position ensures that a losing streak does not end your trading adventure. As you gain experience, you can always increase your position size slowly. This simple trading system would have yielded a profitable trade of 70 “pips”, but do remember that the past is never a guarantee of future results. Please be aware that trading is risky and can result in significant losses.
The Best Forex Demo Accounts
To master the Alligator trading strategy it is important that you practice it. Reading the signals the indicator correctly timing your entry and exit points are skills that need to be mastered in order to maximise your profits. Please be aware that trading is risky and can result in significant losses. This is where a forex demo account comes in: It allows you to practice your new strategy without risking any of your hard-won capital. Below we have picked out some of our favourite forex demo accounts to help you out.
| Broker | Features | Regulator | Platforms | Next Step | |
|---|---|---|---|---|---|
 Your capital is at risk
Founded: 2014 Your capital is at risk
Founded: 2014 |
|
FSPR | MT4 | ||
 Your capital is at risk
Founded: 2006 Your capital is at risk
Founded: 2006Europe* CFDs ar... |
|
ASIC, FSA, FSB, MiFID | MetaTrader4, Sirix, AvaOptions, AvaTrader, Mirror Trader | ||
|
Between 74-89 % of retail investor accounts lose money when trading CFDs |
|
ASIC, FCA | MetaTrader 4, MetaTrader 5, cTrader | ||
|
|
|
ASIC, CySEC, IFSC | MT4 Terminal, MT4 for Mac, Web Trader, iPhone/iPad Trader, Droid Trader, Mobile Trader, MT5 | ||
 Your capital is at risk
Founded: 2006 Your capital is at risk
Founded: 2006 |
|
CySEC, DFSA, FCA, FSB, SIA | MetaTrader4, MetaTrader5, cTrader, FxPro Edge (Beta) | ||
|
|
|
CySEC, FSC, FSCA, MISA | MT4, MT5, OctaTrader | ||
Example Parabolic SAR Indicator strategy trade
Now that you understand the concepts behind using the Parabolic SAR in a trading environment, let’s take a moment to review a real-time situation in today’s forex market. We will also employ two of Wilder’s other creations, the ADX and the ATR, to help form an opinion of the trading opportunity at hand. Remember that the SAR can signal that a change in price direction is imminent, but the ATR and ADX will help with timing and gauging the trend’s strength.
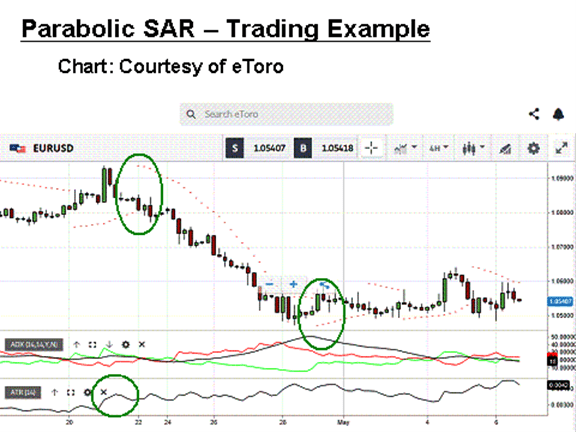
Here we have a 4-Hour chart for the “EUR/USD” currency pair. We will focus on the signals within the Green circle and the two Green ovals. When the ATR makes a sudden increase, it is a good sign that investors are beginning to make a move, but this indicator does not suggest the direction of the move. For direction, we shift our focus to the first Green oval. The SAR has switched over to a bearish tilt. As for the strength of the trend, a reading over “25” for the ADX is interpreted as strong, with over “50” meaning very strong and “100”, extremely strong.
It is time to short the Euro. Secure a position and place a stop loss at “60” pips above your entry point, based on the average SAR spacing over candlesticks. As the downtrend progresses, the ADX gets stronger, but we are waiting for the SAR to switch over and the ADX to wane. These two things occur in the second Green oval. Once closed, the recorded gain would be roughly 400 pips, an excellent profit indeed. Please be aware that trading is risky and can result in significant losses.
Conclusion
John Wilder’s Parabolic SAR indicator is a very useful tool to have in your technical toolbox, especially if you combine it with his ATR and ADX indicators. The SAR is good at predicting pricing shifts in strong trends, but it is weak during choppy markets and does not speak to the timing or the strength of the anticipated trend reversal. The ATR and ADX serve that purpose and complement the SAR’s capabilities.
The Parabolic SAR is not perfect, but with hours of practise on a demo system, you can learn the nuances of this indicator, combined with its companions, and gain an edge in the forex market.
Continue Learning
- More Forex Indicators Explained
- Relative Vigor Index Explained
- Demarker Indicator Explained
- Aroon Indicator Strategy

Forextraders' Broker of the Month
BlackBull Markets is a reliable and well-respected trading platform that provides its customers with high-quality access to a wide range of asset groups. The broker is headquartered in New Zealand which explains why it has flown under the radar for a few years but it is a great broker that is now building a global following. The BlackBull Markets site is intuitive and easy to use, making it an ideal choice for beginners.