The Euro/Polish Zloty currency pair (also referred to as EURPLN and EUR/PLN) is considered an exotic currency pair. In this article, we will examine how EURPLN is performing.
EURPLN Key Stats
- 2021 high: 4.7429
- 2021 low: 4.4321
- YTD high: 5.0031
- YTD low: 4.4824
- YTD % change: +5.28%
EURPLN Forecast
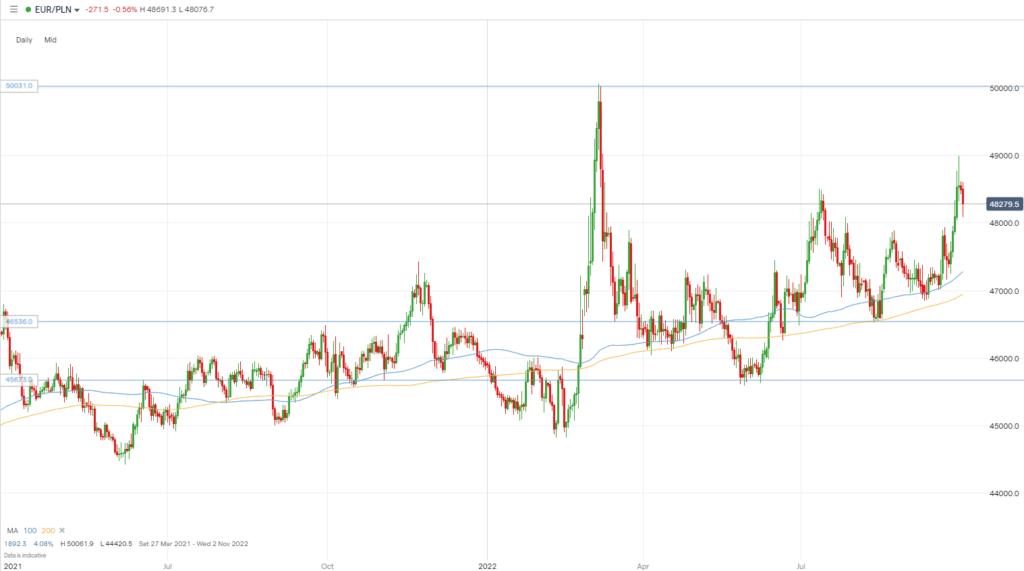
The EURPLN has been steadily climbing since the start of 2020, gaining over 5% this year. While it would not surprise us at all to see price continue to rise in the near to mid-term, the current economic uncertainty in Europe means it is crucial to execute prudent risk management when trading the pair. We see a potential pullback in the near term but an eventual move higher once the price edges back towards its 100 MA on the daily chart.
EURPLN Fundamental Analysis
Understanding what moves currency on a day-to-day basis can help traders establish a directional bias. The macroeconomic environment is impacted by economic activity and factors such as unemployment, consumer spending, GDP, inflation, and much more. As a result, it is essential to understand the current macroeconomic climate.
The euro has been heavily affected this year by external factors. The Russia-Ukraine war has caused an energy crisis for Europe. Annual inflation has jumped to 9.1%, the biggest reason being energy prices. Prices generally have surged, resulting in the ECB raising interest rates by 75 basis points in September. In addition, the European Central Bank is expected to continue raising rates.
Over recent months, the euro has been a heavy talking point, hitting major lows vs. the US dollar, with Russia halting gas supplies heightening fears about a deepening energy crisis. The euro has had a significant inverse correlation with natural gas prices in recent months. With energy prices rising, the euro has been sinking as Europe attempts to break away from Russian energy supplies.
The Polish Zloty is less prominent compared to the euro. The invasion of Ukraine by Russia has put a strain on the zloty and other eastern European currencies, with energy prices soaring. Furthermore, Poland’s central bank raised rates by 25 basis points to 6.75% as they battle soaring inflation. This was less than expected, causing the PLN to come under pressure. However, Poland has led with a hawkish tone, with central banker Joanna Tyrowicz mentioning the potential for raising rates by 2 to 3 percentage points.
Related Articles
- USDPLN Forecast and Live Chart
- EURUSD Forecast and Live Chart
- What Are Minor Forex Pairs?
- Forex Charts
EURPLN Technical Analysis
Technical analysis is used by many successful traders, either alongside fundamental analysis or on its own. We believe that using both to identify currency pair moves is the ideal option. In addition, technical analysis can help investors identify areas to enter and exit positions.
For example, the 4.6536 area for EURPLN is a support level to watch out for. If the price pulls back to this area, you may see bullish traders enter back into the market. On the other hand, if the area breaks, we could see a move further to the downside. Additional support levels include 4.5673 and 4.4834. We also have to consider resistance levels to the upside. These are areas where price may struggle to break through. One such area is the previous high of 5.0031.
Furthermore, the EURPLN is trading above its 100-day MA on the daily chart, which has held well as a support level of late.
Trade EURPLN with our top brokers
| Broker | Features | Regulator | Platforms | Next Step | |
|---|---|---|---|---|---|
 Your capital is at risk
Founded: 2014 Your capital is at risk
Founded: 2014 |
|
FSPR | MT4 | ||
 Your capital is at risk
Founded: 2006 Your capital is at risk
Founded: 2006Europe* CFDs ar... |
|
ASIC, FSA, FSB, MiFID | MetaTrader4, Sirix, AvaOptions, AvaTrader, Mirror Trader | ||
|
Between 74-89 % of retail investor accounts lose money when trading CFDs |
|
ASIC, FCA | MetaTrader 4, MetaTrader 5, cTrader | ||
|
|
|
ASIC, CySEC, IFSC | MT4 Terminal, MT4 for Mac, Web Trader, iPhone/iPad Trader, Droid Trader, Mobile Trader, MT5 | ||
 Your capital is at risk
Founded: 2006 Your capital is at risk
Founded: 2006 |
|
CySEC, DFSA, FCA, FSB, SIA | MetaTrader4, MetaTrader5, cTrader, FxPro Edge (Beta) | ||
|
|
|
CySEC, FSC, FSCA, MISA | MT4, MT5, OctaTrader | ||

Forextraders' Broker of the Month
BlackBull Markets is a reliable and well-respected trading platform that provides its customers with high-quality access to a wide range of asset groups. The broker is headquartered in New Zealand which explains why it has flown under the radar for a few years but it is a great broker that is now building a global following. The BlackBull Markets site is intuitive and easy to use, making it an ideal choice for beginners.