

The Average Directional Movement Index or “ADX” indicator is a member of the Trend family of technical indicators. J. Welles Wilder created the ADX in 1978 to complement his other creative efforts in technical analysis by measuring the strength of trend forces. Traders use the index to determine if a trend will extend or gradually lose its strength; valuable information when setting entry and exit levels in the forex market.
Are you interested in learning about the unique properties of the ADX indicator system? In the following paragraphs, we will illustrate the computations behind this unique technical tool, how it can be used in forex trading, how it can be incorporated into a simple trading strategy within your plan, and, lastly, by reviewing a real-time forex trading example of how it can help you to improve your investments.
John Wilder was one of the foremost leaders in the field of technical analysis. Born in Norris, Texas, this American legend first acquired a degree in Mechanical Engineering, then chose real estate development as a career, and finally followed his true passion by developing a series of popular technical indicators that have stood the test of time. Forex traders know him for his breakthrough creations, like the Relative Strength Index (RSI), the Parabolic SAR, the Average True Range indicator (ATR), and, lastly, the Average Directional Index (ADX). His 1978 book, New Concepts in Technical Trading Systems, remains a key sourcebook in the trading industry.
The ADX can also be classified as an oscillator since the various curves within the indicator box fluctuate between zero and 100. The “signal” line of the indicator rarely goes above 60, but values below 25 indicate a weak trend, and values from 25 to 50 suggest a strong one. This indicator consists of three lines, one each for measuring descending and ascending trends, referred to as “DM” or Directional Movement lines, and then a Signal line representing the absolute force of the net ascending and the descending trend.
The Average Directional Index is all about measuring the strength of a trend by breaking it down into its components and parts, either up or down forces. By combining these inputs and arriving at a Signal line, the trader can gauge the direction and momentum of the present price action, a major key in developing winning trading strategies. The ADX, like all indicators, is capable of false-positive alerts from time to time. Correctly interpreting the signals of the ADX indicator requires practice on a demo system, and it works best when combined with other indicators.
| Broker | Features | Regulator | Platforms | Next Step | |
|---|---|---|---|---|---|
 Your capital is at risk
Founded: 2014 Your capital is at risk
Founded: 2014 |
|
FSPR | MT4 | ||
 Your capital is at risk
Founded: 2006 Your capital is at risk
Founded: 2006Europe* CFDs ar... |
|
ASIC, FSA, FSB, MiFID | MetaTrader4, Sirix, AvaOptions, AvaTrader, Mirror Trader | ||
|
Between 74-89 % of retail investor accounts lose money when trading CFDs |
|
ASIC, FCA | MetaTrader 4, MetaTrader 5, cTrader | ||
|
|
|
ASIC, CySEC, IFSC | MT4 Terminal, MT4 for Mac, Web Trader, iPhone/iPad Trader, Droid Trader, Mobile Trader, MT5 | ||
 Your capital is at risk
Founded: 2006 Your capital is at risk
Founded: 2006 |
|
CySEC, DFSA, FCA, FSB, SIA | MetaTrader4, MetaTrader5, cTrader, FxPro Edge (Beta) | ||
|
|
|
CySEC, FSC, FSCA, MISA | MT4, MT5, OctaTrader | ||
How is the ADX Indicator calculated?
The ADX indicator is available on Metatrader4 trading software, and its rather complex calculation sequence involves the following general computations:
- Positive and negative DM indicators are developed based on the previous period’s high/low values.
- An Average DM for N periods is calculated for positive and negative trends.
- Each Average DM is normalised by dividing it by the “Average True Range” (ATR), another indicator, to arrive at two independent indexes.
- A directional Signal index is computed as an absolute value per cent of the difference between the two DM’s divided by their sum.
- Lastly, a moving average of the Directional Index is calculated for N periods.
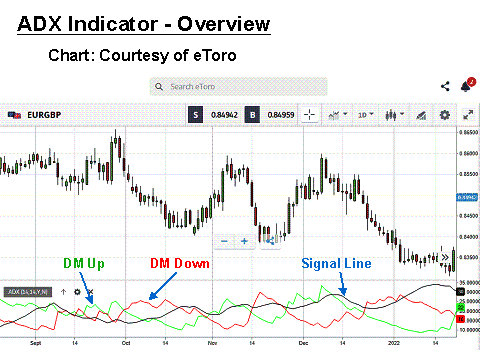
Wilder was known for his trading systems, which incorporated his innovative indicators. As noted in the above steps, the ATR performs a role in producing both the DM Up and DM Down lines. Software programs on today’s trading platforms perform the necessary computational work instantly and produce an ADX indicator, as displayed in the bottom portion of the previous overview chart.
The ADX indicator will typically have three lines of differing colours. In the example above, the “Black” line is the ADX Signal line, while the “Green” line represents ascending directional movement and the “Red” line, the descending DM. The values for each of the three lines of the ADX are always absolute. They are always positive, never negative. The ADX does not necessarily indicate that a reversal is imminent. Other oscillators are better suited for this purpose, but it does speak to momentum and directional strength.
Related Articles
How to use the ADX Indicator in forex trading
A trader must remember that the ADX signal line is an absolute value, always a positive number measuring the strength of either a positive or negative trend. The ADX can be used to determine the potential for market changes depending on the movement of values, but confirmation from another indicator is advised. If the ADX moves over 25 points from its lower values, attention is given as it approaches the 40 line. The ADX generates trading signals when the two minor DM lines cross one another, with special consideration given to peaks in the Signal line.
A weakness of this oscillator is that many crossovers can be false signals if the currency pair moves in a sideways fashion. There are also several examples in other trading mediums, like stocks, for example, where the ADX reading might suggest a weak trend while prices have ascended gradually over a long period. Strength does not always equate to a positive or negative movement in prices. Additional support from another indicator is required for a correct interpretation of price behaviour in these specific instances.
Let’s take another look at the overview chart and what is happening:
In this daily chart for the “EUR/GBP” currency pair, the first portion of the price action is ranging. The DM lines for the ADX are choppy at best, and the Signal line is generally below a 25 reading. Post-October, things begin to change. In fact, for the remainder of the chart, the Signal line continues to establish higher highs. However, this succession of higher peaks is not an indication that a reversal is at hand. It is a message that the velocity of price action, i.e., momentum, is steadily increasing
The rollercoaster of price behaviour after October forms a strong downward trend. The channel formed is a direct divergence from what the ADX signal line is showing, which keeps rising until it hits the 40-level. The advantage for the trader is in knowing that momentum is not subsiding. It is time to hang onto a short trade and ride the trend until momentum subsides. An aggressive trader might have opened and closed several positions over this interval. Note how the DM up and DM down lines cross near key reversal points.
A quick review of how to use the average directional index indicator is as follows:
- Measure of Momentum Strength: Weak trends generally stay below a value of 25. From 25 to 50, the trend is said to be strong and can even register in higher ranges for very strong and extremely strong trend variations. Values below 25 are classified as an accumulation or distribution phase, although there are exceptions. The key observation for a trader at this juncture is that prices always break out of ranging behaviour – the longer the period, the stronger the breakout. Your patience will be rewarded.
- DM Crossovers: During ranging periods, crossovers are not necessarily indicative of what may come. Once the Signal line is above 25, it is time to take note of DM crossovers and prepare for changes in price direction.
- Peak Action of the Signal Line: it is important to understand that a peak in the Signal line is not a signal of an imminent price reversal. It is, however, an indication that momentum is ebbing. A succession of peaks, either up or down, is an ongoing report that the momentum of price changes is increasing or decreasing. The trend is your friend during these up periods, and it is time to let your winners run.
A simple ADX Indicator trading strategy
Forex traders use technical analysis to determine optimal entry and exit points in the market. They focus on the ADX key points of reference, which are high points and line crossovers. As with any technical indicator, an ADX chart will never be 100% correct in the signals it presents, but the signals are consistent enough to tilt the odds in favour of the trader and provide an edge. Skill in interpreting and understanding ADX signals comes with experience.
In the example below, let’s develop a simple trading system based on an ADX strategy of signals and alerts:
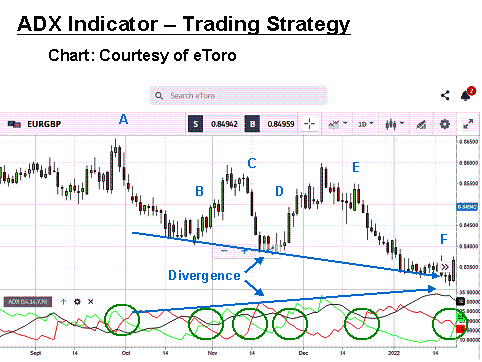
The following trading system is for review purposes only. Technical analysis can be a powerful tool when trading, but it is never perfect. What may work in this example may not in other examples. Over time, however, consistency can be achieved, which will lead to profits. Please be aware that trading is risky and can result in significant losses. With this disclaimer in mind, the “Green” circles on the above chart illustrate optimal entry and exit points based on the ADX strategy alone. “A” through “F” annotations illustrate those regions on the candlesticks. The divergence noted suggests a patient holding strategy, as well.
A simple trading system would then be:
- Determine your entry/exit points when the “Green” line crosses the “Red” line in an upward movement, accompanied by the ADX “Signal” line moving above 25.
- Execute a “Buy” or “Sell” order for no more than 2% to 3% of your account.
- Place a stop-loss order at 25 “pips” below your entry point.
Steps “2” and “3” represent prudent risk and money management principles that should be part of your trading plan. The ADX does not hint at the correct placement of a Stop Loss order. An average is suggested in this example, but you could also have used an ATR indicator to guide your placement.
In summary, the ADX did not rise past 25 until the third green circle. Conducting a short trade from that point until the final green circle could have yielded a gain of 200 pips. If you had been a nimble trader, you could have gained another 300 pips via trades from points “D” and “E”. If you had used additional indicators, then the opportunity for trades from “A” through “C” could have added another 250 pips to the total.
Example ADX Indicator strategy trade
Now, let’s look at the “EUR/GBP” currency pair on a 4-Hour timeframe. We have added Bollinger Bands (BBs) to clarify trader sentiment and an RSI for signalling oversold and overbought conditions.
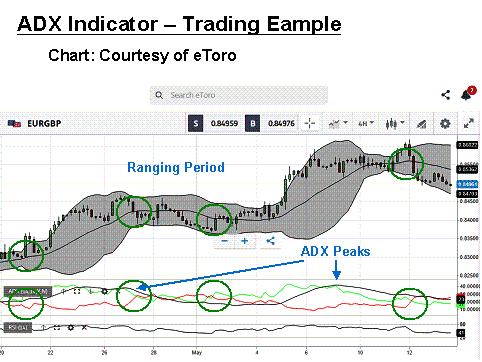
There are two modest trends in this real-time example with a short ranging period in between the two opportunities. In the first trade, the Signal line crossed 25, and the BBs expanded – time to enter a long position. After the ADX peaked, we begin to plan our exit. It occurs when the two DMs cross, the RSI dips, and the Bollingers contract – result = 150 pips.
While the pair ranges, we look for our next entry. It is when the price bounces forcefully off the lower BB limit, the RSI crosses its midline, and the DMs cross. The ADX signal is still below 25, but other indicators helped us. After another ADX peak, we exit under similar previous conditions – result = 150 pips. This ADX strategy, in combination with the Bollinger Bands and the RSI, has netted two very nice gains totalling 300 pips, a fine addition to any trader’s monthly journal of trades.
Conclusion
The Average Directional Movement Index or ADX indicator can be a formidable tool in your forex trading toolbox, but it is most effective when combined with other technical indicators. Learning how to use this helpful indicator and incorporate it into your daily routine is best achieved with hours of practice trading on a free demo system.
Once you have become familiar with this ADX trading strategy and are confident with its limitations and its strengths, give it a test in real-time. Start with small amounts and work your way up. Be wary when the ADX is below 25. Look for support from other indicators, and do not fret if false alerts occur. No indicator system is perfect, but the ADX indicator can provide the edge needed to win consistently in the forex market.
Continue Learning
- More Forex Indicators Explained
- Simple Moving Average Strategy
- Stochastics Indicator Explained
- Williams Percent Range Strategy

Forextraders' Broker of the Month
BlackBull Markets is a reliable and well-respected trading platform that provides its customers with high-quality access to a wide range of asset groups. The broker is headquartered in New Zealand which explains why it has flown under the radar for a few years but it is a great broker that is now building a global following. The BlackBull Markets site is intuitive and easy to use, making it an ideal choice for beginners.