The U.A.E Dirham/Indian Rupee currency pair (also referred to as AEDINR and AED/INR) is an exotic currency pair. In this article, we will examine how AEDINR is performing.
Article Sections:
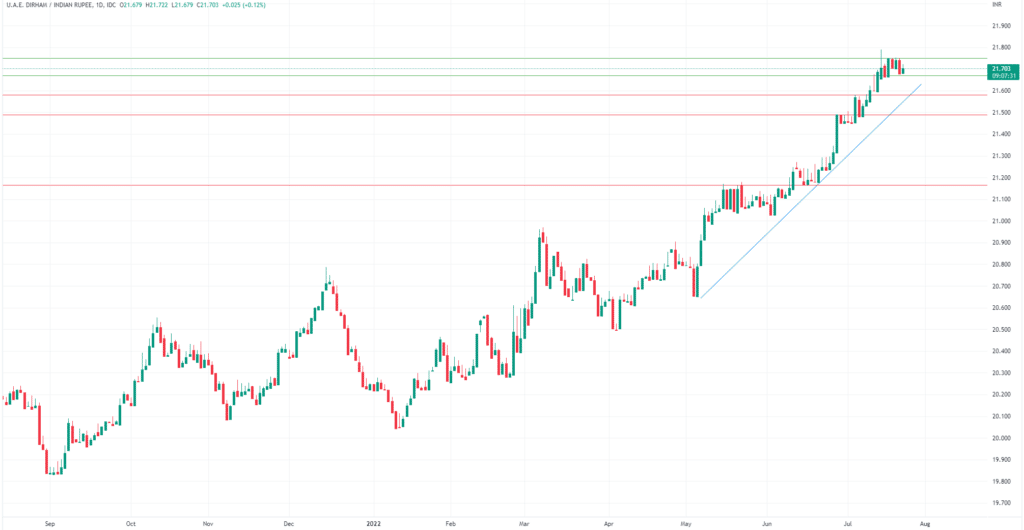
- Live Chart (Tradingview widget)
- Key Stats: List key data points for the currency pair
- 2021 high: 20.78
- 2021 low: 19.61
- YTD high: 21.79
- YTD low: 20.04
- YTD % change: +7.35%
Forecast Summary
The current consensus view for the pair would suggest it is going higher in the near term. However, we see a potential near-term decline after such a run higher due to the recent slide in oil prices. Over the longer term, we sit on the sidelines due to the current macro uncertainty and lack of clarity regarding where we think oil prices will go.
Related Articles
- GBPINR Forecast and Live Chart
- AUDINR Forecast and Live Chart
- What Are Exotic Forex Pairs?
- Forex Charts
Fundamental Analysis
The forex market, like most others, is significantly influenced by macroeconomic factors. This year alone, several macroeconomic elements have influenced the direction of markets. For example, the Ukraine-Russia conflict, inflation, soaring energy prices, and more are impacting how markets move. Therefore, keeping up to date with economic/geopolitical data and activity is essential.
The AED or United Arab Emirates Dirham is pegged to the dollar and considered one of the most stable currencies in the world when it comes to exchange rate stability. The US dollar peg is because the UAE relies on its oil exports. With oil prices denominated in US dollars, the UAE’s decision to peg its currency to the dollar helps to reduce the volatility of its exports. As mentioned, the UAE relies heavily on its oil and gas reserves, which means a rise in oil prices will strengthen its currency. Oil prices have surged this year due to the Ukraine-Russia war, boosting the AED.
Rising commodity prices have affected the Indian rupee in 2022. As a result, the Reserve Bank of India has increased interventions to slow its currency’s decline and maintain stability, protecting importers and exporters from potential shocks. Furthermore, during times of economic instability, investors will typically exit positions in what they perceive as riskier currencies such as the rupee and invest in so-called safe-haven currencies such as the Japanese yen and US dollar. As a result, the recent market downturn, inflation, and economic worries have seen the INR fall so far this year.
Technical Analysis:
Support Levels:
- 21.58
- 21.48
- 21.16
Resistance Levels:
- 21.67
- 21.79
Given the Indian rupee’s struggles and the rise in oil prices, we have obviously seen a strong run higher in the pair since the start of the year, reaching all-time highs. Looking higher, the apparent areas to watch out for are the top of the current range at 21.67 and the all-time high at 21.79. Beyond that, we would be looking at psychological levels such as 21.90 and 22.00.
To the downside, 21.58 is a level to keep an eye on, while 21.48 is also an area to potentially target if you see price declining. Further lower, 21.16 looks to be a very key area as well as 21.02.
Trade AEDINR with our top brokers:
| Broker | Features | Regulator | Platforms | Next Step | |
|---|---|---|---|---|---|
|
73% of retail C... |
|
FSA SC | MT4, MT5 | ||
 Your capital is at risk
Founded: 2014 Your capital is at risk
Founded: 2014 |
|
FSPR | MT4 | ||
 Your capital is at risk
Founded: 2006 Your capital is at risk
Founded: 2006Europe* CFDs ar... |
|
ASIC, FSA, FSB, MiFID | MetaTrader4, Sirix, AvaOptions, AvaTrader, Mirror Trader | ||
|
Between 74-89 % of retail investor accounts lose money when trading CFDs |
|
ASIC, FCA | MetaTrader 4, MetaTrader 5, cTrader | ||
|
77 % of retail investor accounts lose money when trading CFDs with this provider. You should consider whether you understand how CFDs work, and whether you can afford to take the high risk of losing your money. |
|
ASIC, CySEC, FCA | eToro Platform | ||
|
|
|
ASIC, CySEC, IFSC | MT4 Terminal, MT4 for Mac, Web Trader, iPhone/iPad Trader, Droid Trader, Mobile Trader, MT5 | ||
 Your capital is at risk
Founded: 2006 Your capital is at risk
Founded: 2006 |
|
CySEC, DFSA, FCA, FSB, SIA | MetaTrader4, MetaTrader5, cTrader, FxPro Edge (Beta) | ||

Forextraders' Broker of the Month
BlackBull Markets is a reliable and well-respected trading platform that provides its customers with high-quality access to a wide range of asset groups. The broker is headquartered in New Zealand which explains why it has flown under the radar for a few years but it is a great broker that is now building a global following. The BlackBull Markets site is intuitive and easy to use, making it an ideal choice for beginners.